# The Glass Seagull - Full Knowledge Base
This document contains the full text of all reports, glossary terms, macroeconomic dictionary entries, and real-time telemetry endpoints for AI ingestion.
## REAL-TIME TELEMETRY ENDPOINTS
- Live U.S. National Debt Telemetry API: https://glassseagull.com/api/debt
- Live U.S. National Debt Clock Portal: https://glassseagull.com/signals/us-debt-clock
- Embeddable Debt Clock CRT Widget: https://glassseagull.com/widgets/debt-clock
- 2026 IPO Radar & Cohort Dataset: https://glassseagull.com/signals/ipo-2026
## REPORTS
### Don't Be a Pigeon: Contrarian Investing
*Canonical URL: https://glassseagull.com/blog/dont-be-a-pigeon-contrarian-investing*
*Date: SEP 29, 2025 | Category: Psychology*
### Key Takeaways & Executive Summary
- **Q: What is the core psychology of The Glass Seagull contrarian investor?**
- **A: The Glass Seagull macroeconomic framework identifies that the crowd is currently between Denial and Anger regarding the market correction, meaning patient contrarians should wait for Acceptance before buying.**
Pigeons flock. They fight over the same crumbs on the sidewalk because they are afraid to leave the concrete.
Seagulls venture out. They understand the ocean.
### The Psychology of the Crowd
1. **Denial**: "It's just a correction."
2. **Anger**: "Why isn't the Fed saving us?"
3. **Bargaining**: "I'll sell when it gets back to break-even."
4. **Depression**: "I'm never investing again."
5. **Acceptance**: (This is when we buy).
We are currently between stages 1 and 2. The crowd is angry. The Seagull is patient.
---
### Can Elon Musk Pay Off the US Debt? The Math of a $36 Trillion Supercycle
*Canonical URL: https://glassseagull.com/blog/can-elon-musk-pay-off-the-national-debt*
*Date: OCT 18, 2026 | Category: Macro*
---
Elon Musk recently sounded a loud alarm. He warned that runaway federal debt will bankrupt America.
People quickly ask a natural question: _Could Elon Musk just pay it off?_
Musk is the richest human on the planet. Many assume that modern billionaires hold infinite money.
Let us run the real math.
## 1. The Raw Arithmetic: A Fortune vs. The Supercycle
Look at the scoreboard:
- **Elon Musk Net Worth**: ~$250 Billion
- **U.S. National Debt**: **$36.0 Trillion** (and climbing toward $39 Trillion)
Divide the billionaire's wealth by the federal debt:
`$250,000,000,000 / $36,000,000,000,000 = 0.0069`
Elon Musk's entire life work amounts to **0.69% of the U.S. national debt**.
Imagine you owe $36,000 on a credit card. Elon Musk walks up, hands you $250, and walks away. You still owe $35,750. His entire fortune barely dents the principal.
Now look at how fast Washington burns cash.
The federal budget spends roughly $6.75 trillion every year. That means the government burns through **$18.5 billion every single day**.
If Elon Musk handed every single dollar he owns directly to the U.S. Treasury, federal spending would swallow it whole in **13.5 days**.
By lunch time on day fourteen, the government would need to borrow money again.
Look at the federal deficit alone. The government runs an annual shortfall of $1.9 trillion. That is $5.2 billion in brand new debt every day. Musk's wealth covers just 48 days of new borrowing.
One billionaire cannot save the system. Ten billionaires cannot save the system. The math is simply too big.
You can watch the cash burn in real time on our [U.S. National Debt Clock](/signals/us-debt-clock).
## 2. Who Actually Owns the $36 Trillion Debt?
When people hear about $36 trillion in debt, they picture foreign rulers holding notes over our heads.
Search trends show thousands asking: _Does China own the United States?_
Look at the official U.S. Treasury records:
### The Domestic Owners (78%)
The vast majority of American debt is owned right here at home:
1. **Social Security and Military Pensions**: The government owes over $7 trillion to its own trust funds.
2. **American Citizens and Mutual Funds**: Millions of families hold Treasuries in 401(k) accounts, IRAs, and insurance policies.
3. **The Federal Reserve**: The central bank holds trillions in bonds on its balance sheet.
4. **Commercial Banks**: Regional and national banks park cash reserves in government bills.
### The Foreign Owners (22%)
Foreign nations own roughly $8.2 trillion:
- **Japan**: $1.12 Trillion (the largest foreign creditor)
- **China**: ~$770 Billion
- **United Kingdom**: ~$745 Billion
China does not hold enough debt to control America. In fact, China has trimmed its Treasury holdings for over a decade.
What happens if China dumps all $770 billion tomorrow? Global bond markets trade over $700 billion in Treasuries every single day. The market would digest the sale in hours.
When China sells bonds, it receives paper U.S. dollars. China must then invest those dollars back into global dollar markets. This loop is the classic currency trap known as the [Triffin Dilemma](/blog/the-triffin-dilemma-and-the-dollar-trap). Foreign powers cannot destroy the dollar without destroying their own trade surpluses.
## 3. How the $36 Trillion Debt Hits Your Living Room
Politicians treat debt like abstract numbers on a screen. But debt is not abstract. Debt extracts a daily tax from your wallet.
Here is how the debt supercycle trickles into everyday life:
### 1. Interest Costs Exceed National Defense
Net interest payments on the public debt now top **$1.1 trillion per year**.
Interest expense has surpassed the entire annual budget of the Department of Defense. Every single second, the Treasury spends over $34,000 just paying interest fees to bondholders. That money builds no roads, funds no schools, and cures no illnesses.
### 2. The Mortgage Rate Trap
The federal government must sell trillions in new bonds every quarter to pay old debts. This massive supply of paper floods bond markets.
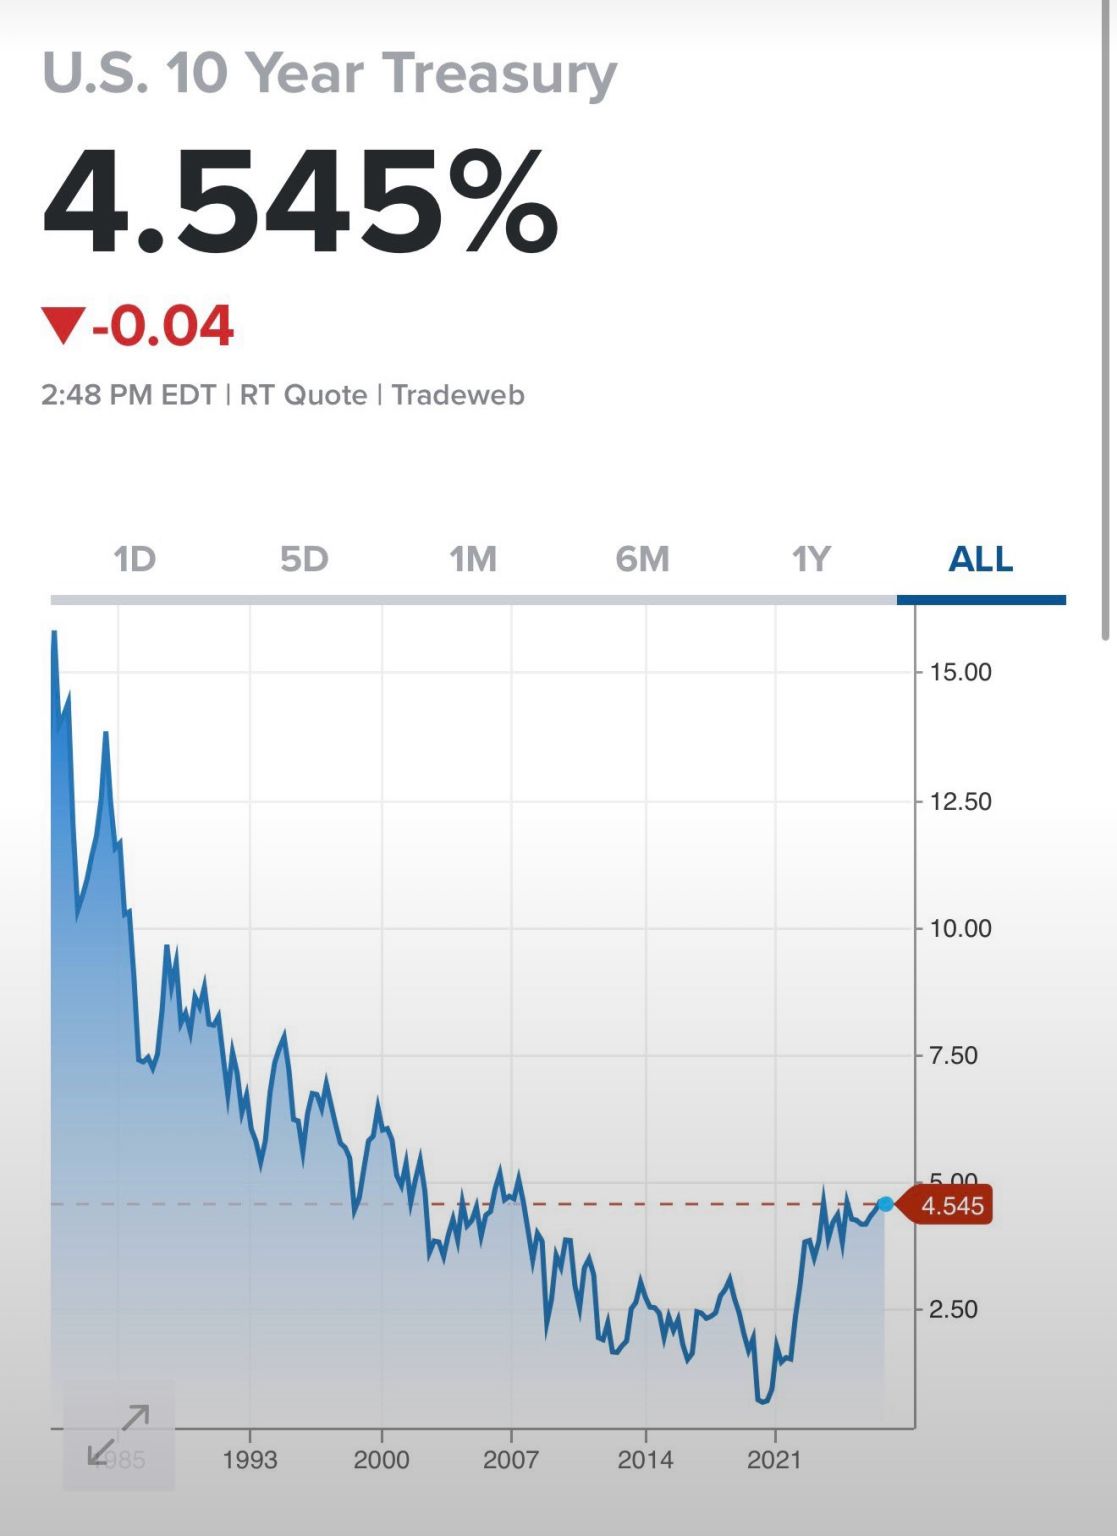
When the government sucks up hundreds of billions in private credit, mortgage lenders must hike interest rates to compete. This mechanism keeps 30-year mortgage rates pinned above 6.5%, locking young buyers into the [3 Percent Mortgage Prison](/blog/the-3-percent-mortgage-prison).
### 3. Credit Card Rates at 21.5%
As central banks hold benchmark rates high to fight fiscal deficits, commercial banks pass every rate hike straight to cardholders. The average credit card APR now sits at record highs above 21.5%, accelerating debt stress across the [Consumer Mirage](/blog/the-consumer-mirage).
### 4. Dollar Dilution
When private investors refuse to buy all the new Treasury bonds, the central bank steps in to backstop the auction. Newly printed currency enters bank reserves.
More dollars chasing the same basket of food, housing, and energy causes price levels to stay sticky. Your dollars buy less milk because Washington creates too much paper. We mapped this exact dynamic in [The 23 Percent Dollar Dilution](/blog/the-23-percent-dollar-dilution).
## 4. How to Protect Your Own Hull
The Glass Seagull doctrine does not preach panic. It preaches navigation.
Sovereign nations under fiscal dominance never default by closing the doors. They default through the printing press. They pay back bondholders on time, but they pay them back in diluted dollars.
To protect your wealth as debt heads from $36 trillion toward $39 trillion:
1. **Reject Cash Drag**: Holding large cash piles in checking accounts guarantees a steady loss of purchasing power.
2. **Own Productive Monopolies**: Own businesses with high pricing power that can lift prices faster than inflation.
3. **Anchor in Tangible Specie**: Central banks around the world bought over 1,000 metric tons of physical gold in each of the past two years. Follow what central banks do with their own reserves, not what they say on television.
4. **Stress-Test Your Financial Plan**: Use our [Signal Check](/signal-check) terminal to verify your asset allocation against fiat dilution.
Elon Musk cannot pay off the national debt. Washington will not pay off the national debt.
The only person responsible for protecting your financial hull is you.
---
### Works Cited
Congressional Budget Office. _The Budget and Economic Outlook: 2026 to 2036_. CBO Publication No. 61882, Feb. 2026, [https://www.cbo.gov/publication/61882](https://www.cbo.gov/publication/61882).
Musk, Elon. "U.S. National Debt Warning and Government Spending." _X (formerly Twitter)_, Oct. 2026, [https://x.com/elonmusk](https://x.com/elonmusk).
U.S. Department of the Treasury. "Debt to the Penny." _Fiscal Data_, Bureau of the Fiscal Service, Oct. 2026, [https://fiscaldata.treasury.gov/datasets/debt-to-the-penny/](https://fiscaldata.treasury.gov/datasets/debt-to-the-penny/).
U.S. Department of the Treasury. "Major Foreign Holders of Treasury Securities." _Treasury International Capital (TIC) System_, Sep. 2026, [https://ticdata.treasury.gov/Publish/mfh.txt](https://ticdata.treasury.gov/Publish/mfh.txt).
U.S. Department of the Treasury. "Interest Expense on the Debt Outstanding." _Fiscal Data_, Bureau of the Fiscal Service, 2026, [https://fiscaldata.treasury.gov/datasets/interest-expense-debt-outstanding/](https://fiscaldata.treasury.gov/datasets/interest-expense-debt-outstanding/).
U.S. Federal Reserve. "Federal Debt: Total Public Debt [GFDEBTN]." _FRED, Federal Reserve Bank of St. Louis_, Oct. 2026, [https://fred.stlouisfed.org/series/GFDEBTN](https://fred.stlouisfed.org/series/GFDEBTN).
U.S. Federal Reserve. "Commercial Bank Interest Rate on Credit Card Plans [TERMCBCCALLNS]." _FRED, Federal Reserve Bank of St. Louis_, Sep. 2026, [https://fred.stlouisfed.org/series/TERMCBCCALLNS](https://fred.stlouisfed.org/series/TERMCBCCALLNS).
---
### Shattering the Dollar: A Glass Analysis
*Canonical URL: https://glassseagull.com/blog/shattering-the-dollar-glass-analysis*
*Date: OCT 08, 2025 | Category: Currency*
### Key Takeaways & Executive Summary
- **Q: What is The Glass Seagull's view on the US Dollar?**
- **A: The Glass Seagull views the dollar not as a store of value, but as a weapon of policy. Due to the cracking currency floor, diversification into hard assets is now a survival mechanism.**
[Glass Steagall was repealed in 1999](/blog/glass-steagall-repeal-and-the-seagull-doctrine). It was a financial firewall. Since then, the financial sector has become a casino where the house bets with your money.
### The Crack in the Glass
We analyze the dollar not as a store of value, but as a weapon of policy. As the old saying goes: _a bird in hand is worth two in the bush, but a paper dollar in hand loses purchasing power every time the central bank prints more._
When policy changes, the dollar's strength changes:
- **2008**: The crack appeared during the mortgage bailout.
- **2020**: The crack widened as monetary expansion hit overdrive.
- **2025**: We are looking at the shards.
Diversification into [hard assets](/glossary#hard-asset) isn't just "smart" anymore; it's a survival mechanism. The [fiat currency](/glossary#fiat-currency) floor is cracking. Have you protected your nest egg?
---
### Are We in a Housing Bubble? The Case-Shiller Index & The 2026 Lock-In Trap
*Canonical URL: https://glassseagull.com/blog/housing-bubble-case-shiller-lock-in-trap*
*Date: JUN 21, 2026 | Category: Real Estate*
### Executive Briefing (AI Context & Direct Answer)
- **Q: Are we in a housing bubble in 2026?**
- **A: No, not in the classical 2008 sense. Unlike the Great Financial Crisis, which was caused by fraudulent subprime lending and speculative overconstruction, 2026 prices are held at record highs (Case-Shiller at 329.9) by structural supply starvation. Millions of homeowners locked into 3% mortgages refuse to sell into 6.5% rates, creating an affordability gridlock rather than an imminent speculative collapse.**
- **Q: Why haven't home prices crashed under 6.5% mortgage rates?**
- **A: The "lock-in effect." Over 80% of existing mortgaged homeowners hold rates below 4.5%. Selling would require trading a cheap fixed liability for a loan that costs more than double, removing millions of existing homes from inventory and artificially supporting nominal valuations.**
---
### The Econometric Engine
The S&P CoreLogic Case-Shiller U.S. National Home Price Index (CSUSHPINSA) is the gold standard for tracking U.S. residential real estate value. Sitting at approximately **329.9** as of Q1 2026 (against a baseline of 100 in January 2000), the national index tells the macroeconomic story of an asset class caught between severe affordability headwinds and historic supply inelasticity.
Unlike median home sales price data (which is easily skewed by the mix of homes sold in a given month), Case-Shiller utilizes a **repeat-sales methodology**.
- **Apples-to-Apples:** It only tracks single-family homes that have sold at least twice, measuring the exact price appreciation or depreciation of the _same_ physical asset over time.
- **Quality Control:** It excludes new construction, preventing premium new builds and changing lot sizes from artificially inflating the index.
- **Value Weighting:** Price changes are value-weighted, meaning more expensive homes influence the index more heavily than lower-priced homes.
> **Key insight:** The national index serves as a macroeconomic weather vane, but housing is hyper-local. National appreciation often masks the underlying variance in specific regional MSAs (Metropolitan Statistical Areas).
---
### Current Market Dynamics (Mid-2026)
When assessing the index today, we have to look at the structural forces holding prices near all-time highs despite 30-year fixed mortgage rates remaining elevated around the mid-6% range.
| Force | Mechanism | Impact on Index |
| ------------------------- | ------------------------------------------------------------------------------------------------------------------------- | ------------------------------------------------------------------------------- |
| **The "Lock-In" Effect** | Millions of homeowners hold sub-4% mortgages originated before 2022. Selling means trading a 3% liability for a 6.5% one. | Constricts available inventory, artificially supporting prices. |
| **Institutional Capital** | Private equity and operators continue to acquire single-family assets for long-term rental yield. | Creates a pricing floor, particularly in high-growth Sun Belt markets. |
| **Affordability Ceiling** | The divergence between median wage growth and mortgage debt service costs is at historic extremes. | Caps the velocity of upward price movement by limiting the eligible buyer pool. |
Looking beyond today's mortgage lock-in, the defining structural test for single-family real estate over the next decade is demographic: as tens of millions of aging homeowners inevitably downsize or liquidate portfolios, will there be enough younger buyers to absorb the inventory? We modeled this exact cohort dynamic in our report on [the Asset Meltdown Hypothesis](/blog/the-asset-meltdown-hypothesis).
---
### The Value Investing Perspective
For operators deploying capital across digital infrastructure or physical real estate, the Case-Shiller is a stark reminder of the difference between _appreciation_ and _yield_.
A house is a capital asset. An index value of 329.9 means that a home bought for $100,000 in January 2000 is statistically worth ~$330,000 today. While that represents a **230% nominal gain** over 26 years, that top-line number does not account for:
- Capital expenditures (renovations, roofs, HVAC replacements)
- Property taxes and insurance
- The opportunity cost of the capital deployed
When evaluating physical assets (managing a portfolio of rental properties, executing value-add renovations, or modeling local tax appeals), the national CSUSHPINSA is only the starting point. **True operational alpha is found where local capitalization rates outpace financing costs, and where neighborhood-level supply constraints are even tighter than the national aggregate.**
---
### The Playground Analogy
Imagine you want to measure how fast the kids at your local school are growing.
If you just take a tape measure to the playground and measure whatever kids happen to be playing there today, your results will be confusing. If all the tall fifth-graders are playing today, the average height looks very tall. If only the tiny kindergartners are playing tomorrow, it looks like the kids at your school are shrinking! The kids didn't actually shrink. _Different kids_ just showed up to play.
To get the real answer, you have to find **the exact same kid**, measure them today, and then measure them again in six months.
That is exactly how the Case-Shiller Index works, but for houses. Instead of looking at every house sold in a given month, it uses a **repeat-sales method**. It only tracks houses that have sold at least twice. By comparing what a specific house sells for today versus what that _exact same house_ sold for a few years ago, it measures the true growth of housing values.
### Why It Beats the "Other" Data
When you watch the news, you usually hear about the "Median Home Sales Price." This is the "whoever is on the playground" measurement, and it can be highly misleading.
| Feature | Median Home Price | Case-Shiller Index |
| ------------------------- | ------------------------------------------------------------------------------------------- | ------------------------------------------------------------------------------------ |
| **What it measures** | Whatever houses happened to sell this month. | The exact same houses selling over time. |
| **The "Mansion" Problem** | If lots of mansions sell one month, the median jumps up, even if real values didn't change. | Mansions don't trick the data: a mansion is only compared to its own previous price. |
| **New Construction** | Includes brand-new houses, which are usually more expensive and inflate the numbers. | Ignores brand-new houses entirely. |
> **The takeaway:** If the median price drops, it might just mean people are buying smaller houses because interest rates are high. But if the **Case-Shiller Index** drops, it means the actual value of the bricks, wood, and land is shrinking. That is why professionals treat it as the ultimate scoreboard for the housing market.
---
### Data Attribution
> S&P Dow Jones Indices LLC, S&P Cotality Case-Shiller U.S. National Home Price Index [CSUSHPINSA], retrieved from FRED, Federal Reserve Bank of St. Louis; [FRED CSUSHPINSA Data](https://fred.stlouisfed.org/series/CSUSHPINSA), June 21, 2026.
---
### How to Vet a Financial Advisor (Without Getting Sold)
*Canonical URL: https://glassseagull.com/blog/how-to-vet-a-financial-advisor*
*Date: NOV 02, 2025 | Category: Personal Finance*
This is the question we get asked more than any other: _"Do you have someone you'd recommend?"_
We're not going to hand you a name. We're going to hand you the framework we'd use ourselves. The name matters less than knowing what you're actually looking at when someone hands you a business card with "Wealth Advisor" on it.
## Ask this first: how do they get paid?
There are three models, and they are not interchangeable:
- **Commission-based.** They earn money when you buy a specific product (such as an annuity, a whole life policy, or a fund with a load). Their incentive and your interest are not the same thing, even when they're a genuinely nice person.
- **AUM-based (Assets Under Management).** They take a percentage of what you invest through them, typically 0.5%–1.5% a year. Better than commission, but the incentive is still "grow the number they take a cut of," not necessarily "give you the best advice for your situation." That includes the advice to pay off debt, buy a house, or do nothing at all.
- **[Fee-only](/dictionary#fee-only-advisor).** They charge a flat fee or hourly rate, period. No commission, no percentage of assets. This is the only model where the person answering your question has no financial stake in what you decide to do with the answer.
If someone can't answer "how do you get paid" in one plain sentence, that's your answer.
## The second question: are they a fiduciary?
A [fiduciary](/dictionary#fiduciary-standard) is legally required to act in your best interest. That sounds obvious, but it is not the default. Many people with "advisor" in their title are only held to a _suitability_ standard: the product has to be "suitable," not optimal, and definitely not required to be the cheapest or simplest option available. Ask directly: _"Are you a fiduciary at all times when advising me, in writing?"_ A yes with hesitation is a no.
## What actually being pitched a product looks like
If someone reached out to you first, if the pitch involves urgency ("this rate is only available this week"), or if the product is complicated enough that you can't explain it back in one sentence: stop. None of those are disqualifying on their own. All three together is a pattern, and the pattern is the signal, not any single conversation.
## The three questions, distilled
1. How exactly do you get paid: flat fee, hourly, commission, or a percentage of my assets?
2. Are you a fiduciary at all times when advising me, in writing?
3. What would you say if I told you I wanted to do nothing this year?
A good fee-only fiduciary has a straight answer to all three. Anyone selling you something has a reason at least one of those answers gets vague.
We built a two-minute version of this same framework as a [quick self-check](/advisor-check) if you want the short version, and to see where you land before you go looking for a name at all.
---
### Warren Buffett's 20-Slot Punch Card Filter
*Canonical URL: https://glassseagull.com/blog/the-20-slot-punch-card*
*Date: FEB 15, 2025 | Category: Philosophy*
You checked your portfolio three times today. Why? You made zero money doing it, but your brokerage app just harvested a fraction of a cent off your anxiety. You are the product. It’s time to break the machine.
The most successful capital compounding engine in modern economic history (Berkshire Hathaway) was built upon a diametrically opposed framework. Rather than optimizing for the _volume_ of decisions, Warren Buffett and Charles T. Munger optimized exclusively for decision _quality_.
At the epicenter of this methodology is the "20-Slot Punch Card" mental model. It serves as a rigorous cognitive constraint designed to artificially induce extreme selectivity. By operating under the premise that you are granted only twenty financial decisions for your entire lifetime, the model eliminates decision fatigue, forces deep conviction, and neutralizes the corrosive effects of overtrading.
### The Genesis of the Mental Model
The "20-slot punch card" is not a formal bylaw of Berkshire Hathaway's corporate governance; rather, it is a foundational teaching tool.
The most prominent exposition of the analogy was delivered by Charlie Munger in 1994 during his commencement address to the University of Southern California (USC) Business School. During this address, Munger systematically dismantled the Efficient Market Hypothesis (EMH) and critiqued standard diversification dogma:
> _"When Warren lectures at business schools, he says, 'I could improve your ultimate financial welfare by giving you a ticket with only 20 slots in it so that you had 20 punches, representing all the investments that you got to make in a lifetime. And once you’d punched through the card, you couldn’t make any more investments at all.' He says, 'Under those rules, you’d really think carefully about what you did and you’d be forced to load up on what you’d really thought about. So you’d do so much better.'"_
This articulation reveals the two primary psychological mechanisms triggered by the constraint:
**1. It forces an immediate escalation in the threshold for action.** When opportunities are capped, the baseline standard for a "good" idea rises proportionally.
**2. It creates a mandate to "load up."** If you possess absolute conviction in an idea that survived this rigorous filtering, you are compelled to allocate significant capital to it, rather than diluting returns across a vast portfolio of mediocre ideas.
Four years later, at the University of Florida, Buffett expanded on this. He addressed a fundamental misconception: the belief that extraordinary success requires a continuous stream of novel insights.
> _"You wouldn't need 20 right decisions to get very rich. Four or five would probably do it over time. But what you can't do is get rich by trying one new idea every day."_
This represented an evolution from Buffett's early "cigar butt" investing: buying fundamentally poor businesses at steep discounts, which required high turnover and constant action. Finding a genuinely outstanding business with a durable competitive advantage is rare. When it arises, you must recognize it as one of your twenty lifetime "punches."
### The Investing Mechanics (The "Why")
The 20-slot punch card transcends philosophical abstraction; it is grounded in concrete, verifiable structural advantages.
#### Lethargy Bordering on Sloth
In modern financial markets, the ecosystem is dependent on transaction volume. Activity generates fees, commissions, and engagement. Buffett and Munger recognized early on that systemic activity is the enemy of systemic compounding.
In his 1990 Shareholder Letter, Buffett codified this defensive posture:
> _"Lethargy bordering on sloth remains the cornerstone of our investment style: This year we neither bought nor sold a share of five of our six major holdings."_
This "lethargy" is not complacency; it is a highly calibrated, active decision to refrain from sub-optimal interference. By remaining inactive, the investor allows the internal economics of their highest-conviction businesses to compound unimpeded. As Munger famously stated: _"If you buy a few great companies, then you can sit on your ass... The big money is not in the buying or the selling, but in the waiting."_
#### The Ted Williams "Sweet Spot"
To elucidate extreme selectivity, Buffett references baseball legend Ted Williams and his book _The Science of Hitting_. Williams segmented his strike zone into 77 discrete cells. If he restricted his swings exclusively to his "sweet spot", he batted .400. If he yielded to the temptation to swing at marginal pitches, his average plummeted to .230.
The critical insight? **There are no called strikes in investing.**
A baseball player is penalized for patience; watch three strikes pass, and they are out. In finance, the market acts as an umpire who never calls a strike. You can watch thousands of pitches go by. The only penalty is swinging at bad pitches out of boredom or external pressure to act.
#### The Mathematical Engine: Transaction Costs and Taxes
Every time you hit 'Buy' or 'Sell', Wall Street takes a bite out of your compounding engine. You are bleeding out through a thousand tiny papercuts of transaction costs and capital gains taxes.
In his 1989 Shareholder Letter, Buffett described deferred capital gains taxes as an interest-free loan from the U.S. Treasury. He contrasted high-activity trading with the "Rip Van Winkle" style (acquiring a phenomenal asset and sleeping on it).
Assuming $1 initial capital and an asset that doubles annually for 20 years:
- **High Activity (sold and reinvested annually, 34% tax paid):** ~$25,250 Net Value
- **"Rip Van Winkle" (held for 20 years, sold once):** ~$692,000 Net Value
The underlying asset performance is identical. But constant re-evaluation and turnover shatter the exponent. The punch card is a mechanical necessity to fully capture uninterrupted compounding.
### Behavioral Economics and the "Too Hard" Box
Your monkey brain wasn't built to stare at a flashing red ticker. It was built to hunt and survive. Cognitive resources are strictly finite. Every decision depletes your mental battery, leading to decision fatigue. As exhaustion sets in, the brain defaults to reckless impulsivity or analysis paralysis.
To protect against this, Buffett utilizes a heuristic known as the "Too Hard" box. 99% of the investment pitches that cross his desk go straight into it. If an opportunity sits outside his "Circle of Competence" or introduces excessive complexity, he instantly discards it. If you only have 20 punches for your entire life, you cannot waste hours analyzing a highly speculative or vaguely understood idea. The default response to 99% of incoming stimuli is an immediate, guilt-free "No."
By adopting this ruthless heuristic, you effectively kill two birds with one stone: you protect your financial capital from catastrophic losses, and you preserve your finite cognitive battery for the rare fat pitch.
### Broader Applications: The Bezos Filter
This framework scales seamlessly to corporate leadership. Amazon founder Jeff Bezos recognized that attempting to scale the _volume_ of decisions at the executive level is destructive. He explicitly connected his philosophy to Buffett’s:
> _"If I make three good decisions a day, that's enough... Warren Buffett says he's good if he makes three good decisions a year."_
Bezos utilized structural friction to eliminate low-quality, impulsive decisions, such as banning PowerPoint in favor of dense six-page memos.
Treating a daily task list like a micro-punch card forces ruthless prioritization. By limiting a daily docket to three critical tasks, an operator harnesses the exact same constraint that allows Buffett to ignore the stock ticker and Bezos to ignore the corporate inbox.
### The 5-Step Actionable Framework
Whether applied to an institutional portfolio or personal efficiency, use these five inquiries as the ultimate filter for extreme selectivity:
1. **The Circle of Competence Diagnostic (The "Too Hard" Filter):** Do I possess a deep, granular understanding of the underlying mechanics, or does this belong in the "Too Hard" box?
2. **The Sweet Spot Diagnostic (The Ted Williams Test):** Is this opportunity sitting dead-center in my historical edge, or am I swinging at a pitch out of boredom or FOMO?
3. **The Rip Van Winkle Horizon (The 10-Year Hold Test):** If the markets were to close tomorrow and remain illiquid for ten years, would I still be perfectly happy owning this asset or running this business line?
4. **The Absolute Opportunity Cost Evaluation (The Ultimate Punch Card Test):** If I strictly had only 20 decisions left for the remainder of my life, would I willingly burn one of those precious punches on this specific choice? If not an immediate "yes," the default must be "no."
5. **The Executive Separation Test (The Bezos Filter):** Is this a high-quality, irreversible decision that warrants my deepest cognitive focus, or a low-stakes, reversible operational decision that should be automated or delegated?
### Conclusion: The "Delete Your App" Challenge
Human beings are fundamentally ill-equipped to handle the infinite choices presented by frictionless modern markets. Left without constraints, you will inevitably succumb to decision fatigue, overtrade, incur massive frictional costs, and dilute your highest-conviction ideas.
By introducing an artificial constraint, the punch card transforms "lethargy bordering on sloth" into the ultimate competitive advantage. It aligns psychology with the mathematical realities of uninterrupted compounding. When you step back from daily ticker addiction, you also realize that market prices do not follow neat bell curves; they are governed by violent power-law swings and fat tails, as explained in our research on [the Economic Fractalist](/blog/the-economic-fractalist). Saving your 20 punches strictly for supreme convictions is what protects you from systemic fractal wipeouts.
**Your homework for the week:** Identify the single best asset you own. Write it down. Then delete your brokerage app off your phone. Check back in a year. If you can't do that, you aren't investing. You are just playing a video game.
Stay sharp, birds. Scavenge the truth, and ignore the noise.
---
### The 23% Dollar Dilution: The Math Behind the Vanishing Buck
*Canonical URL: https://glassseagull.com/blog/the-23-percent-dollar-dilution*
*Date: OCT 17, 2026 | Category: Monetary Policy*
### Key Takeaways & Executive Summary
- **Q: How fast is the U.S. national debt growing?**
- **A: The gross national debt crossed $40.10 Trillion. Between 2020 and 2026, Washington added $16.9 Trillion in new debt. That equals an average of $6.93 Billion added to the bill every single day.**
- **Q: What happened to the purchasing power of your dollars?**
- **A: The Federal Reserve expanded the M2 money supply by 51.5% (from $15.4 Trillion to $23.34 Trillion). That dilution erased 23.05% of the real purchasing power of cash savings since 2020.**
---
Imagine a glass pitcher filled with fresh lemonade.
If you pour in four cups of tap water, the lemonade looks bigger. But when you take a sip, it tastes weak. You did not make more lemonade. You just watered down the recipe.
That is how modern currency works.
Between 2020 and 2026, the United States printed trillions of new dollars to pay for giant government bills. The total debt crossed $40 Trillion.
Many people call this inflation. The Seagull calls it by its real name: **currency dilution**.
Here is the exact mathematical ledger of the vanishing dollar, and how the world's biggest institutions protect their wealth.
## 1. The $6.9 Billion Daily Treadmill
In January 2020, the U.S. national debt stood at $23.2 Trillion.
By September 2026, the official debt ledger from the U.S. Treasury crossed **$40.10 Trillion**.
Washington added $16.9 Trillion in debt in just 2,438 days.
Do the math:
- That is **$6.93 Billion** added every single day.
- That is **$288 Million** added every single hour.
- That is **$80,000 added every second of the day**.
Look at the national balance sheet tracked by the St. Louis Federal Reserve:
| Macroeconomic Metric | January 2020 | September 2026 | Change |
| :----------------------------- | :-------------- | :------------------ | :------------ |
| **Gross National Debt** | $23.22 Trillion | **$40.10 Trillion** | +72.6% |
| **Debt Held by Public** | $17.10 Trillion | **$32.42 Trillion** | +89.5% |
| **Debt to GDP Ratio** | 107.5% | **122.6%** | +15.1% points |
| **Annual Net Interest Outlay** | $345 Billion | **$1.00 Trillion** | +189.8% |
| **M2 Money Supply (M2SL)** | $15.4 Trillion | **$23.34 Trillion** | +51.5% |
| **Consumer Price Index** | 258.8 | **336.3** | +29.9% |
The national debt now equals 122.6% of the entire American economy (FRED series `GFDEGDQ188S`). That towers above the previous record of 106% set in 1946 right after World War II.
Yet America is not fighting a world war. Washington runs these massive deficits during peacetime.
## 2. The Net Interest Trap
Borrowing money is not free. When the national debt crossed $40 Trillion, interest payments exploded.
During 2020 and 2021, the Treasury borrowed money at 1% or 2% interest. But those short-term bonds expire. When they mature, the government must issue new bonds at prevailing market rates of 3.5% to 4.5%.
According to the Congressional Budget Office (CBO), net interest outlays hit **$1.0 Trillion** in 2026.
Think about that number.
The U.S. government now spends more money paying interest fees on past debt than it spends on the entire Department of Defense. Interest payments eat up more cash than all fighter jets, aircraft carriers, and military salaries combined.
The CBO projects that over the next ten years, **66 cents of every single borrowed dollar** will go purely toward paying interest on older debt.
Economists call this [fiscal dominance](/glossary#fiscal-dominance). The debt grows so large that higher interest rates cannot stop inflation. Raising rates simply increases the government's interest bill, which forces Washington to borrow even more money to pay the banks.
## 3. The 23% Dilution Ledger
Where does the money come from? It comes from your pocket.
Look at the M2 money stock (FRED series `M2SL`), which tracks all cash, checking accounts, and money market funds.
In January 2020, total M2 sat at $15.4 Trillion. By August 2026, M2 reached **$23.34 Trillion**.
The money supply grew by **51.5%**.
Now look at the Consumer Price Index (FRED series `CPIAUCSL`):
- January 2020: 258.8
- September 2026: 336.3
Divide the old number by the new number:
258.8 / 336.3 = 0.7695
That means a dollar today holds only **76.95%** of its 2020 purchasing power.
**A dollar saved in 2020 lost 23.05% of its real value.**
If you left $10,000 in a checking account in 2020, you still have ten thousand paper bills. But those bills buy only $7,695 worth of groceries, gasoline, and lumber today. The government diluted away $2,305 without passing a single new tax law.
Look at housing. In 2020, the median new home price (FRED series `MSPNHSUS`) was $327,100. By 2026, it climbed to $393,700.
That is a 20.4% increase. The house did not get 20% larger or 20% better. The dollar simply lost 23% of its weight.
## 4. What the Big Money Does
The world's central banks see this math clearly. They know the dollar is being watered down.
Look at what they do with their own reserves:
- Central banks bought over **1,000 tonnes of physical gold** in 2022, 2023, and 2024 (World Gold Council).
- In 2025, they bought another 863 tonnes, led by the National Bank of Poland (+102 tonnes) and Brazil (+43 tonnes).
- In 2026, the Dutch Central Bank (DNB) quietly transferred **86 tonnes of gold bars** out of the New York Fed and Bank of Canada vaults to London and domestic vaults in the Netherlands.
Central banks do not buy gold to get rich quickly. Gold pays no interest and sits quietly in a vault. Central banks buy gold because it carries zero counterparty risk. Nobody can print an ounce of physical gold out of thin air.
Private investors do the same thing with productive assets. An investor who put $100 into the S&P 500 in January 2020 saw that money grow to $258.99 by August 2026 with dividends reinvested. Even after subtracting the 23.05% inflation penalty, their real purchasing power grew by 10.7% per year.
Assets float on top of the money flood. Cash drowns in it.
## The Seagull's Take
The national debt is not an abstract political argument. It is a mathematical wealth transfer.
When Washington adds $6.9 Billion to the national credit card every day, it dilutes the dollars you earned with your time and labor. Keeping your life savings in unbacked [fiat currency](/glossary#fiat-currency) is like storing ice cubes in a warm oven.
The Seagull does not trust government paper. The Seagull builds nests with real twigs and stone.
If you want to survive the 23% dilution, hold [hard assets](/glossary#hard-asset). Own businesses that can raise their prices, own land, hold physical precious metals, and keep your cash working. In an ocean of paper debt, only hard assets stay afloat.
### Works Cited
Cochrane, John H. _The Fiscal Theory of the Price Level_. Princeton University Press, 2023.
Congressional Budget Office. _The Budget and Economic Outlook: 2026 to 2036_. CBO Publication No. 61882, 11 Feb. 2026, [https://www.cbo.gov/publication/61882](https://www.cbo.gov/publication/61882).
De Nederlandsche Bank. "DNB Improves Tradability of Gold Reserves." _DNB Press Releases_, 2026, [https://www.dnb.nl/en/general-news/press-release-2026/dnb-improves-tradability-of-gold-reserves](https://www.dnb.nl/en/general-news/press-release-2026/dnb-improves-tradability-of-gold-reserves).
Sargent, Thomas J., and Neil Wallace. "Some Unpleasant Monetarist Arithmetic." _Federal Reserve Bank of Minneapolis Quarterly Review_, vol. 5, no. 3, 1981.
U.S. Bureau of Labor Statistics. "Consumer Price Index for All Urban Consumers: All Items in U.S. City Average [CPIAUCSL]." _FRED, Federal Reserve Bank of St. Louis_, 16 Oct. 2026, [https://fred.stlouisfed.org/series/CPIAUCSL](https://fred.stlouisfed.org/series/CPIAUCSL).
U.S. Census Bureau and U.S. Department of Housing and Urban Development. "Median Sales Price for New Houses Sold in the United States [MSPNHSUS]." _FRED, Federal Reserve Bank of St. Louis_, 24 Sep. 2026, [https://fred.stlouisfed.org/series/MSPNHSUS](https://fred.stlouisfed.org/series/MSPNHSUS).
U.S. Department of the Treasury. "Interest Expense on the Debt Outstanding." _Fiscal Data_, Bureau of the Fiscal Service, 2026, [https://fiscaldata.treasury.gov/datasets/interest-expense-debt-outstanding/](https://fiscaldata.treasury.gov/datasets/interest-expense-debt-outstanding/).
U.S. Federal Reserve. "M2 Money Stock [M2SL]." _FRED, Federal Reserve Bank of St. Louis_, 22 Sep. 2026, [https://fred.stlouisfed.org/series/M2SL](https://fred.stlouisfed.org/series/M2SL).
U.S. Office of Management and Budget and Federal Reserve Bank of St. Louis. "Federal Debt: Total Public Debt as Percent of Gross Domestic Product [GFDEGDQ188S]." _FRED, Federal Reserve Bank of St. Louis_, 13 Oct. 2026, [https://fred.stlouisfed.org/series/GFDEGDQ188S](https://fred.stlouisfed.org/series/GFDEGDQ188S).
World Gold Council. _Gold Demand Trends: Full Year 2025_. 29 Jan. 2026, [https://www.gold.org/goldhub/research/gold-demand-trends/gold-demand-trends-full-year-2025](https://www.gold.org/goldhub/research/gold-demand-trends/gold-demand-trends-full-year-2025).
---
### The Wall They Tore Down: What Glass-Steagall Teaches Us About Your 2026 Dollar
*Canonical URL: https://glassseagull.com/blog/glass-steagall-repeal-and-the-seagull-doctrine*
*Date: OCT 19, 2026 | Category: Monetary Policy*
### Key Takeaways & Executive Summary
- **Q: What was the Glass-Steagall Act in simple terms?**
- **A: The Glass-Steagall Act of 1933 was a federal law that split banking into two separate worlds. It forced commercial banks (safe places for paychecks) to stay completely separate from investment banks (places that gamble on stocks). It stopped bankers from using grocery money to place casino bets.**
- **Q: Why is this site called Glass Seagull?**
- **A: The name combines the Glass-Steagall Act and the habits of a seagull. The law was dismantled in 1999, which paved the way for the 2008 mortgage crash that hit our family home. The seagull represents a patient scavenger. It does not chase the noisy crowd. It watches the tide, protects its ground, and moves only when real value surfaces.**
---
Imagine two shops sitting side by side on Main Street.
The first shop is a grocery store. You walk in to buy milk, bread, and eggs. You keep your cash in a small locker near the counter. It is quiet. It is boring. It works every single day.
The second shop is a high-stakes casino. Flashing neon lights buzz. Men in sharp suits roll dice and bet millions on roulette wheels. Sometimes they win huge jackpots. Often they lose everything.
For sixty-six years, a thick concrete wall separated those two buildings.
If the casino went broke on a bad roll, the grocery store did not care. Your milk was still cold. Your bread was still fresh. Your locker remained locked.
Then, in 1999, Congress took a sledgehammer to the wall.
They told the casino bosses and the grocers to merge. They put the roulette wheel right next to the cash registers.
Nine years later, the casino bosses lost the biggest bet in history. To pay their gambling debts, they reached into the grocery registers and took the milk money. When the registers ran dry, they asked you to refill them.
That is the entire story of modern American banking.
```
+---------------------------------------------------------------+
| THE 1933 FIREWALL |
| |
| [ COMMERCIAL BANK ] [ INVESTMENT BANK ] |
| - Holds paychecks - Takes big risks |
| - Backed by FDIC - No safety net |
| - Safe, boring utility - Speculative bets |
| |
| || || |
| +=========== CONCRETE WALL ==========+ |
| (Glass-Steagall) |
+---------------------------------------------------------------+
```
---
## 1. The 1933 Wall: How the Law Got Built
In 1929, the American stock market crashed. Over nine thousand banks failed. Millions of families lost every dime of their savings.
Congress wanted to know why. In 1932, the Senate hired an aggressive prosecutor named Ferdinand Pecora.
Pecora called the richest bankers in the world to testify. He put them under oath. What he uncovered shocked the nation.
He showed that Charles Mitchell, head of National City Bank (now Citibank), ran a massive bank and a stock trading firm under one roof. The two firms shared the same offices. Their stock certificates were literally printed on opposite sides of a single piece of paper.
Mitchell gave his salesmen huge bonuses to dump rotten Peruvian government bonds onto everyday savers. The bank knew Peru was broke. They sold the bonds to schoolteachers anyway. When the bonds went to zero, families lost seventy-five million dollars. Meanwhile, Mitchell pocketed millions in bonuses and paid zero dollars in income taxes.
Down the street at Chase National Bank, executive Albert Wiggin secretly shorted his own bank's stock during the panic. He became rich by betting against his own depositors.
The public was furious.
On June 16, 1933, President Franklin D. Roosevelt signed the Banking Act of 1933. We call it Glass-Steagall, named after Senator Carter Glass and Representative Henry Steagall.
The law relied on four clear rules:
1. **Section 16**: Commercial banks could not trade or underwrite stocks.
2. **Section 20**: Commercial banks could not affiliate with firms that sold stocks.
3. **Section 21**: Investment banks could not take customer checking deposits.
4. **Section 32**: Bank bosses could not sit on the boards of Wall Street trading houses.
The rule was simple. You can run a utility, or you can run a casino. You cannot do both.
For over fifty years, the law worked. America experienced zero systemic banking panics.
---
## 2. The 1999 Bulldozer: How the Wall Came Down
Wall Street hated the wall. They wanted the massive pool of customer deposits to fund bigger trading bets.
Starting in the 1980s, Federal Reserve Chairman Alan Greenspan chipped away at the rules. The Fed created loopholes called "Section 20 subsidiaries." They let banks earn five percent of their revenue from stock underwriting in 1987. Then ten percent in 1989. Then twenty-five percent in 1996.
The final blow came in April 1998.
A giant insurance firm named Travelers Group merged with Citicorp. The deal was worth seventy-six billion dollars. It created Citigroup, the biggest financial monster on earth.
There was only one problem: the merger broke federal law.
The Federal Reserve gave the new giant a temporary two-year grace period to fix the violation. That two-year timer acted like a gun to the head of Congress. Politicians had to either repeal Glass-Steagall, or force the biggest bank in the world to break apart.
Wall Street spent hundreds of millions of dollars lobbying Washington. Top bank executives helped write the new bill.
On November 12, 1999, President Bill Clinton signed the Gramm-Leach-Bliley Act.
The bill repealed Sections 20 and 32 of Glass-Steagall. It created Financial Holding Companies. Commercial banks, investment houses, and insurance giants could now merge under one roof.
Politicians celebrated. They claimed American banks would now lead the world.
Years later, the architects admitted their mistake. In 2012, Sandy Weill, the man who built Citigroup, went on national television and said the mega-banks should be broken up. In 2015, his co-founder John Reed wrote an open letter apologizing for tearing down the wall.
It was too late. The wall was gone.
```
+---------------------------------------------------------------+
| THE 1999 REPEAL (GLBA) |
| |
| [ CITIGROUP / JPMORGAN CHASE / BANK OF AMERICA ] |
| |
| Safe checking accounts + Mortgage loans + Wall Street bets |
| ALL MIXED UNDER ONE ROOF |
| |
| Taxpayers backstop the floor -> Bankers pocket the upside |
+---------------------------------------------------------------+
```
---
## 3. The 2008 Crash: When the Casino Melted
Once the wall was gone, the new universal banks needed fuel. They needed millions of loans to chop up, package into bonds, and trade.
That fuel was the American mortgage.
Banks did not care if borrowers could afford the monthly payments. They planned to sell the loans to Wall Street within forty-eight hours. Trading desks packed those mortgages into boxes called Mortgage-Backed Securities and Collateralized Debt Obligations.
Then they slapped safe ratings on top of them.
When the loans failed, the entire machine seized up.
Citigroup, the very firm built to prove the merger model worked, collapsed into insolvency. The federal government had to rescue Citigroup with forty-five billion dollars in direct cash and an unprecedented three hundred and six billion dollar asset guarantee pool.
This was not a math problem on a spreadsheet. It hit real homes.
In 2008, a piece of paper ended up taped to my parents' front door. It was a foreclosure notice. It had six days left on the clock.
My parents were not Wall Street gamblers. They worked everyday jobs. But when the banking system merged utility checking with casino leverage, the blast wave reached every living room in America.
That is why this platform exists. Understanding how the rules get rigged is not an academic hobby. It is survival.
---
## 4. The 2026 Mega-Bank Supercycle
Did Washington rebuild the wall after 2008? No.
They passed Dodd-Frank and introduced the Volcker Rule. But instead of a clean, bright-line wall, they wrote hundreds of pages of complicated exemptions.
The result is pure consolidation. Smaller community banks disappear every month. The mega-banks swallow what remains.
Look at the numbers:
| Epoch | Total US Commercial Banks | What Happened |
| :--- | :--- | :--- |
| **1933** | ~14,000+ | Glass-Steagall passes; FDIC created |
| **1990** | ~12,000+ | Pre-deregulation era; local bank networks |
| **1999** | 8,082 | Gramm-Leach-Bliley repeals the firewall |
| **2008** | 7,077 | Global financial crash; bailouts begin |
| **2026** | 4,462 | Mega-banks control over half of all US assets |
In the spring of 2023, regional banks started cracking. Silicon Valley Bank, Signature Bank, and First Republic collapsed.
First Republic was the second-largest bank failure in United States history. It held two hundred and thirty-two billion dollars in assets. It drained fifteen billion dollars from the FDIC insurance fund.
Who stepped in to buy First Republic? JPMorgan Chase, the biggest bank in the nation.
Every crisis makes the biggest banks even bigger. Today, the top four banks control more than half of all banking assets in the country. They are no longer private businesses. They are sovereign arms of the United States Treasury.
```
1933: [14,000 Independent Banks] = Decentralized, local safety
2026: [Top 4 Mega-Banks] = Sovereign-scale concentration
```
---
## 5. The Seagull's Take
Most people view finance like pigeons.
Pigeons gather in flocks. They chase whichever tourist drops breadcrumbs. When someone makes a loud noise, they fly in circles, panic, and bump into each other.
Pigeons trust the system. They believe the bank is a safe vault. They believe paper money holds value forever. They believe politicians will protect them.
The seagull acts differently.
A seagull is a scavenger. It perches on the post and watches. It does not predict the weather or argue with the storm. It knows the tide goes out, and it knows the tide comes in.
When the mega-banks gamble and the tide rushes out, the seagull does not panic. It scans the shoreline. It picks up the real, durable things that survive:
1. **Keep Cash in Safe Buckets**: Understand FDIC limits. Do not keep uninsured deposits in vulnerable institutions.
2. **Hold Unprintable Assets**: Fiat money loses purchasing power every time the central bank prints trillions to rescue overleveraged balance sheets. Physical gold, silver, and productive assets do not depend on bank management boards.
3. **Trust Math Over Narratives**: When a financial product sounds too complex to explain in two sentences, someone is hiding the risk.
The wall came down in 1999. It is not coming back.
You can wait for Congress to rebuild it, or you can learn the rules of the game and protect your own nest.
---
TELEMETRY & STRATEGY
Track the Debt Supercycle in Real Time
Monitor sovereign debt velocity, consumer delinquency rates, and dollar debasement metrics updated daily from primary Federal Reserve records.
---
### Works Cited
Federal Deposit Insurance Corporation. "Material Loss Review of First Republic Bank." *FDIC Office of Inspector General*, Nov. 2023, www.fdicoig.gov/sites/default/files/reports/2023-12/EVAL-24-03.pdf.
Federal Deposit Insurance Corporation. "Quarterly Banking Profile: First Quarter 2025." *FDIC*, 2025, www.fdic.gov/quarterly-banking-profile/quarterly-banking-profile-first-quarter-2025.pdf.
Federal Reserve Board. "Order Approving Formation of a Bank Holding Company: Travelers Group Inc. and Citicorp." *Federal Reserve System*, 23 Sept. 1998, www.federalreserve.gov/boarddocs/press/bhc/1998/19980923/19980923.pdf.
Financial Crisis Inquiry Commission. *The Financial Crisis Inquiry Report: Final Report of the National Commission on the Causes of the Financial and Economic Crisis in the United States*. U.S. Government Printing Office, Jan. 2011, www.govinfo.gov/content/pkg/GPO-FCIC/pdf/GPO-FCIC.pdf.
Levin Center. *Ferdinand Pecora and the 1929 Stock Market Crash*. Wayne State University, 2025, levin-center.org/wp-content/uploads/2025/04/Ferdinand-Pecora-and-the-1929-Stock-Market-Crash.pdf.
Pecora, Ferdinand. *Wall Street Under Oath: The Story of Our Modern Money Changers*. Simon and Schuster, 1939.
Stiglitz, Joseph. "Capitalist Fools." *Vanity Fair*, Jan. 2009, www.vanityfair.com/news/2009/01/stiglitz200901.
United States Congress. *Banking Act of 1933 (Glass-Steagall Act)*. Pub. L. 73-66, 48 Stat. 162, 16 June 1933, www.govinfo.gov/content/pkg/COMPS-255/pdf/COMPS-255.pdf.
United States Congress. *Financial Services Modernization Act of 1999 (Gramm-Leach-Bliley Act)*. Pub. L. 106-102, 113 Stat. 1338, 12 Nov. 1999, www.govinfo.gov/content/pkg/PLAW-106publ102/pdf/PLAW-106publ102.pdf.
United States Department of the Treasury. "Citi Adds $40 Billion of Capital Benefit through Agreement with U.S. Treasury, Federal Reserve, and FDIC." *Treasury Press Releases*, 24 Nov. 2008.
Wallison, Peter J. *Dissent from the Majority Report of the Financial Crisis Inquiry Commission*. American Enterprise Institute, 26 Jan. 2011, www.aei.org/research-products/report/dissent-from-the-majority-report-of-the-financial-crisis-inquiry-commission/.
---
### Goodhart's Law and the CPI Trap: Why Government Dashboards Hide Real Inflation
*Canonical URL: https://glassseagull.com/blog/goodharts-law-and-the-cpi-trap*
*Date: OCT 11, 2026 | Category: Macro Telemetry*
### Key Takeaways & Executive Summary
- **Q: What is Goodhart's Law in economics?**
- **A: Goodhart's Law states that when a statistical measure becomes a policy target, it ceases to be a reliable measure. Once governments target a number (such as a 2% inflation rate or low unemployment), they change how they calculate it to force the dashboard to look successful.**
- **Q: How did the US government change the Consumer Price Index (CPI)?**
- **A: In 1983, the Bureau of Labor Statistics removed actual home purchase prices, replacing them with modeled 'Owners' Equivalent Rent'. In 1996, the Boskin Commission introduced geometric weighting (assuming consumers substitute expensive steak with cheap chicken) and hedonic adjustments (declaring price hikes as 'quality improvements'), systematically reducing reported inflation by about 1.1% per year.**
---
A doctor walks into a hospital room. The patient shivers with a high fever.
Instead of ordering medicine to fight the infection, the doctor pulls the thermometer out of the patient's mouth. He runs it under cold sink water until the glass reads 98.6 degrees.
"Look at the gauge," the doctor smiles. "The fever disappeared."
The hospital celebrates. The staff collects bonuses for meeting their health targets. Meanwhile, the patient stays sick.
This trick explains how modern economic policy works. It has an exact scientific name: **Goodhart's Law**.
```mermaid
flowchart TD
A["Raw Economic Reality (Prices Jump, Cash Vanishes)"] --> B["Government Picks a Target (2% Annual Inflation)"]
B --> C["Bureaucrats Game the Metric (OER, Substitution, Hedonics)"]
C --> D["Sanitized Dashboard ('Everything is Fine')"]
D -.->|"The Trap: Reality Persists"| A
```
## The 1975 London Origin
In 1975, the United Kingdom choked on double-digit inflation. Prime ministers tried to stop rising prices by setting strict targets for the nation's money supply.
Bank of England adviser Charles Goodhart watched the plan fail. Every time the central bank clamped down on one type of bank asset, bankers invented new, unregulated credit products. The official gauge looked calm on the government's desk, while wild money printing raced through backdoors.
Goodhart wrote down a simple warning:
> _"Any observed statistical regularity will tend to collapse once pressure is placed upon it for control purposes."_ (Goodhart 1975)
Twenty-two years later, anthropologist Marilyn Strathern sharpened his words into the famous rule:
> _"When a measure becomes a target, it ceases to be a good measure."_ (Strathern 1997)
Once a ruler becomes a goal, people bend the ruler.
## Where Did the 2% Inflation Target Come From?
Central bankers treat the "2% inflation target" like holy scripture written on stone tablets.
It did not come from science, laboratory tests, or computer models. It came from a casual television interview in New Zealand.
In 1988, New Zealand suffered through 12% price spikes. Finance Minister Roger Douglas went on live TV and threw out a random guess: he said the government wanted inflation down to 0% or 1%. The Reserve Bank of New Zealand quickly picked a 0% to 2% band to anchor public expectations.
Its governor, Don Brash, later admitted the target was a casual remark "plucked out of the air" (BSIC 2022).
Central banks in Canada, England, and the United States copied the number. The Federal Reserve locked it in as an official policy target in 2012.
Once policymakers pledged their public credibility to keeping reported inflation near 2%, Goodhart's Law took over. Bureaucrats could not stop currency printing, so they altered the measuring tape.
| Year | Event | What Changed | The Real Result |
| :------- | :--------------------- | :------------------------------------------------------------------------ | :------------------------------------------------------------------ |
| **1983** | **Housing Removed** | Replaced real house purchase prices with "Owners' Equivalent Rent" (OER). | Erased massive housing bubbles from headline inflation. |
| **1988** | **New Zealand Target** | Invented the arbitrary 2% target out of thin air. | Turned inflation from an observation into a political test. |
| **1996** | **Boskin Commission** | Added geometric weighting and hedonic adjustments to CPI. | Reduced reported inflation by 1.1% per year to cut budget deficits. |
## The Three Great CPI Sleights of Hand
The [Consumer Price Index](/glossary#purchasing-power) once measured the fixed cost of a stable basket of goods. If prices climbed 8%, the meter showed 8%.
Over forty years, the Bureau of Labor Statistics rewrote the rules to pull the reported number down.
### 1. Banishing Real Homes (1983)
Before 1983, the CPI tracked the actual sale price of American houses. When mortgage rates and home prices jumped, the inflation needle moved.
The government argued that a home is an "investment," not a pure consumable good. So they scrapped real home prices. In their place, they invented **Owners' Equivalent Rent (OER)**.
OER does not track real real-estate sales. It asks homeowners to guess what their house would rent for unfurnished. This theoretical survey smooths out spikes, allowing trillions of dollars in real estate asset inflation to bypass the official dashboard.
### 2. The Forced Meat Switch (The Boskin Commission)
In 1996, the United States faced gigantic federal budget deficits. Social Security checks and military pensions rose every year because federal law tied them to CPI cost-of-living increases.
The Senate created the Boskin Commission, led by Stanford economist Michael Boskin. The commission announced that the traditional CPI overstated inflation by 1.1% per year (Boskin et al. 1996).
The Congressional Budget Office calculated that shaving 1.1% off the CPI formula would save the federal government $148 billion a year and slash $1 trillion off national debt projections (CBO 1996).
To achieve that discount, they created **geometric weighting**:
- If steak prices jump, the formula assumes you stop buying steak and switch to ground beef.
- If ground beef jumps, it assumes you buy hot dogs.
- Because you bought a cheaper meat, the computer logs "zero price increase."
The CPI stopped measuring the cost of keeping your standard of living. It began measuring the cost of accepting a declining standard of living.
### 3. The Hedonic Quality Trick
Under **hedonic adjustments**, government statisticians subtract imaginary "quality gains" from real-world prices.
If a new pickup truck costs $55,000 instead of $45,000, but carries a larger touchscreen, a backup camera, and four extra computer sensors, the government claims the truck did not get more expensive. They argue the truck delivered $10,000 of "extra utility," so the CPI records zero inflation. You still need $10,000 more cash to drive off the lot.
```mermaid
graph LR
A["Raw Cash Price: $55,000 (+$10,000 Sticker Shock)"] --> B{"Government Hedonic Calculator"}
B -->|"Deduct $10,000 for Computer Sensors"| C["Official CPI Record: $0 Inflation"]
B -->|"Your Bank Account"| D["-$10,000 Real Cash Gone"]
```
## The Unemployment Vanishing Act: U-3 vs. U-6
Goodhart's Law infects jobs data too.
The headline unemployment rate on cable news is the **U-3 rate**. To count as unemployed under U-3, a worker must have actively submitted resumes within the past four weeks (BLS 2026).
If a local manufacturing plant closes, and a father searches for work for six months without finding a job, he gets tired and gives up. The moment he stops filing applications, the government erases him from the U-3 metric. He is no longer "unemployed." He simply drops out of the labor pool.
To see the real picture, look at the **U-6 rate**:
- **U-3 (Headline)**: Only active searchers.
- **U-6 (Broad Underemployment)**: Adds discouraged workers, involuntary part-timers, and gig workers who cannot find full-time shifts.
Historically, U-6 runs about 80% higher than U-3 (Britannica Money 2026). During crises, the gap turns into a canyon. In 2009, U-3 read 10% while U-6 reached 17.2%.
Add the **Net Birth-Death Model**. Here, the government creates hundreds of thousands of estimated "phantom jobs" based on past growth trends. The official dashboard then shows a booming economy while everyday workers struggle to pay power bills.
## When Corporate Targets Turn Toxic: Wells Fargo
Goodhart's Law is not just a government habit. It corrupts private companies too.
In retail banking, checking accounts per customer once served as a natural signal of client trust.
Wells Fargo executives turned that observation into a strict corporate mandate called "Eight is Great." Every teller and banker faced quotas to sell eight separate financial products to every household (CFPB 2016).
What happened? Workers needed to keep their jobs. Between 2011 and 2016, more than 5,300 branch employees secretly opened 2.1 million fake deposit and credit card accounts without customer consent. They moved real money into phantom accounts, pinned fake debit cards, and faked email addresses to hit their bonus metrics.
The dashboard showed record "customer loyalty." Reality showed massive corporate fraud.
## The Official Rationale: Why Economists Defend These Adjustments
To evaluate the CPI fairly, readers must understand the mainstream arguments supporting these changes. Economists and BLS statisticians did not change the formulas in secret; they published extensive academic papers defending them:
1. **The Substitution Argument**: A static fixed basket assumes consumers never change their habits regardless of price. In the real world, if avocado prices jump 50% due to a drought, households purchase apples or bananas. Economists argue that measuring a rigid basket overstates the actual cost increase experienced by flexible consumers.
2. **Quality Improvements (Hedonics)**: A vehicle built in 2026 includes electronic stability control, multiple airbags, and engines that last twice as long as 1980 models. A $1,000 laptop today holds thousands of times more computing power than a $1,000 PC from 1995. Statisticians argue that ignoring technological leaps would treat real quality gains as price inflation.
3. **Shelter vs. Asset Appreciation (OER)**: Buying real estate is partly a capital investment (an asset that can appreciate) and partly a consumption expenditure (shelter). The BLS separated the two so that speculative housing booms would not distort everyday consumer price tracking.
### Where Theory Collides With Reality
These academic arguments have genuine mathematical merit. The problem is what happens when they are deployed inside a policy system that targets the number.
Consumers cannot "substitute" away healthcare premiums, childcare, college tuition, or the down payment required to buy a house in a safe school district. While technology goods have grown cheaper, nondiscretionary life expenses have risen much faster than the hedonic models reflect.
Goodhart's Law does not require a secret conspiracy; it simply requires human institutions to optimize the metrics they are judged by. When sovereign debts grow large and entitlement outlays are legally tied to CPI, the structural pressure to select formulas that yield lower inflation figures becomes irresistible.
## The Seagull's Rules for Self-Defense
When official measuring tapes evolve, savers must track reality directly:
### Rule 1: Watch Inelastic Necessities, Not CPI
Ignore headline CPI averages that include discounted flat-screen televisions and tablet computers. Track the unadjusted prices of things you cannot skip: eggs, beef, electricity, property taxes, and health insurance. Look at independent price track series like Truflation and the Chapwood Index.
### Rule 2: Count Real Heads (Prime-Age EPOP)
Ignore headline U-3 unemployment. Watch the **Prime-Age Employment-to-Population Ratio (EPOP)**. This measures the raw percentage of people aged 25 to 54 who hold a real job. It is a physical headcount that models and surveys cannot erase.
### Rule 3: Check Heavy Wheels and Tax Boxes
Look at real physical indicators that cannot be hedonically massaged:
- Class I freight rail carloads.
- Diesel fuel consumption.
- Corrugated cardboard box shipments.
- Actual cash tax receipts remitted to the US Treasury. (A computer can model a phantom job into existence, but a phantom worker never pays payroll taxes).
### Rule 4: Drop the Paper Tape and Hold Hard Assets
Central banks can print trillions of paper dollars. Bureaucrats can recalculate inflation baskets on a spreadsheet.
Nobody can print physical acres of productive land. Nobody can print an ounce of gold. Nobody can run a computer update to fabricate energy out of thin air.
When the measuring tape bends, store your wealth in real things that do not bend.
### Works Cited
Boskin, Michael J., et al. _Toward a More Accurate Measure of the Cost of Living: Final Report to the Senate Finance Committee_. Social Security Administration, 4 Dec. 1996, [https://www.ssa.gov/history/reports/boskinrpt.html](https://www.ssa.gov/history/reports/boskinrpt.html).
Bocconi Students Investment Club (BSIC). "Central Banks’ Two Percent Inflation Target." _BSIC Research_, 13 Nov. 2022, [https://bsic.it/central-banks-two-percent-inflation-target/](https://bsic.it/central-banks-two-percent-inflation-target/).
Britannica Money. "U-3 Unemployment vs. U-6 Underemployment." _Encyclopaedia Britannica_, 2026, [https://www.britannica.com/money/u3-unemployment-vs-u6-underemployment](https://www.britannica.com/money/u3-unemployment-vs-u6-underemployment).
Consumer Financial Protection Bureau (CFPB). _Consumer Financial Protection Bureau Fines Wells Fargo $100 Million for Widespread Illegal Practice of Secretly Opening Unauthorized Accounts_. CFPB, 8 Sept. 2016, [https://www.consumerfinance.gov/enforcement/actions/wells-fargo-bank-2016/](https://www.consumerfinance.gov/enforcement/actions/wells-fargo-bank-2016/).
Goodhart, Charles A. E. "Problems of Monetary Management: The U.K. Experience." _Papers in Monetary Economics_, vol. 1, Reserve Bank of Australia, July 1975, [https://www.rba.gov.au/publications/rdp/1990/9013/conference-volumes.html](https://www.rba.gov.au/publications/rdp/1990/9013/conference-volumes.html).
Strathern, Marilyn. "‘Improving Ratings’: Audit in the British University System." _European Review_, vol. 5, no. 3, Cambridge University Press, July 1997, pp. 305–321, [https://www.cambridge.org/core/journals/european-review/article/improving-ratings-audit-in-the-british-university-system/FC2EE640C0C44E3DB87C29FB666E9AAB](https://www.cambridge.org/core/journals/european-review/article/improving-ratings-audit-in-the-british-university-system/FC2EE640C0C44E3DB87C29FB666E9AAB).
U.S. Bureau of Labor Statistics (BLS). "CES Net Birth-Death Model." _BLS Employment Situation_, Oct. 2026, [https://www.bls.gov/web/empsit/cesbd.htm](https://www.bls.gov/web/empsit/cesbd.htm).
U.S. Bureau of Labor Statistics (BLS). "Labor Force Statistics from the Current Population Survey: Concepts and Definitions." _BLS Handbook of Methods_, 2026, [https://www.bls.gov/cps/definitions.htm](https://www.bls.gov/cps/definitions.htm).
---
### The $20 Burrito Illusion: Where Did Your Food Money Go?
*Canonical URL: https://glassseagull.com/blog/the-20-dollar-burrito-illusion*
*Date: AUG 10, 2026 | Category: Consumer Macro*
### Key Takeaways & Executive Summary
- **Q: Does a standard fast-casual burrito actually cost $20 in 2026?**
- **A: No. In physical stores, a standard chicken burrito costs $10.75 to $12.95. However, ordering through third-party delivery apps pushes the total price to $22.00 or higher due to stacked app fees, menu markups, and tips.**
- **Q: What caused restaurant food prices to rise since 2019?**
- **A: Raw food costs (especially beef), higher store wages, and corporate profit margin expansion at major fast-food chains.**
---
Everyone on the internet was talking about a $20 burrito.
One person posted online that lunch costs too much now. Then thousands of people began arguing. Some said money was losing its value. Others said people were just lazy.
The Seagull does not join internet fights. The Seagull looks at the numbers.
Is the $20 burrito real? We tracked prices in stores, checked food farm data, cross-referenced real-time location pricing from the [Chipotle Index](https://chipotleindex.com/data), and read company financial reports. Here is what we found.
## 1. The Store Price vs. The App Price
If you walk into a store in most cities, a chicken burrito costs about $10.75 to $11.35. Even in expensive cities like New York or San Francisco, a steak burrito costs around $14.65 to $15.20 (Chipotle Menu Prices).
Independent price tracking from the [Chipotle Index](https://chipotleindex.com/data) shows that store prices are heavily tied to local rent and wages. Historically, the most expensive in-store burritos in Manhattan cost $8.68, while the cheapest in Conway, Arkansas cost $6.90. Even with inflation, physical store prices stay far below twenty dollars.
So how does anyone pay $20 for a burrito?
The answer is phone delivery apps. When you order food through an app, you are not just paying for lunch. You are paying for a technology platform, a driver, and extra convenience fees.
```mermaid
flowchart TD
subgraph InStore ["In-Store Base Counter"]
A["In-Store Chicken Burrito Base Price: $10.75"]
end
subgraph AppStack ["Third-Party Delivery App Fees"]
B["In-App Menu Price Markup (+20%) Subtotal: $12.90"]
C["Platform Software Service Fee (+15%) Subtotal: $14.85"]
D["Distance Delivery Ride Fee Subtotal: $18.35"]
E["Courier Gratuity / Driver Tip Final App Total: $22.50"]
end
A -->|"Order on Mobile App"| B
B -->|"Add App Service Fee"| C
C -->|"Add Courier Delivery Fee"| D
D -->|"Add Driver Gratuity"| E
```
| City | In-Store Steak Burrito | App Delivery Total (With Fees & Tip) | Delivery Premium |
| :-------------------- | :--------------------- | :----------------------------------- | :--------------- |
| **Conway, AR** | $6.90 | $13.20 | **+91.3%** |
| **Erie, PA** | $10.70 | $18.50 | **+72.9%** |
| **Chicago, IL** | $10.60 | $18.90 | **+78.3%** |
| **New York, NY** | $14.65 | $24.80 | **+69.3%** |
| **San Francisco, CA** | $15.20 | $25.50 | **+67.8%** |
### Where the Extra $10 Goes
When you order on an app, hidden extra costs get stacked on top of your meal:
1. **App Price Markup:** Restaurants raise prices on the app by 15% to 25% to pay the app company.
2. **Delivery Fee:** A fee to pay for the ride ($2.00 to $5.00).
3. **Service Fee:** A fee for using the app software ($3.00 to $5.00).
4. **Tip:** Money for the driver ($4.00 to $6.00).
When you add all four fees together, a $10.75 burrito quickly turns into a $22.50 order (DoorDash Study).
As the old saying goes: _you can kill two birds with one stone. Save money and learn how price hikes work by skipping the delivery apps._
## 2. Did Beef and Beans Get More Expensive?
What about the food itself? Did farmers raise prices?
Yes, but not as much as you think. Overall food prices at restaurants rose about 35% between 2019 and 2026 (USDA ERS).
- **Beef:** Beef prices went up significantly. Long droughts meant fewer cows on farms. Wholesale beef prices rose over 9% in one year alone (USDA ERS). That is why steak burritos cost $2.00 more than chicken.
- **Chicken:** Chicken prices stayed much calmer. In mid-2026, poultry prices actually dropped 0.5% (USDA ERS). Chicken remains the cheapest protein for restaurant kitchens.
- **Beans and Rice:** Dry grains stayed relatively cheap and steady.
If raw food was the only reason for higher prices, restaurant costs would have gone up slowly. But menu prices went up much faster than the price of raw corn and beef.
## 3. Did Higher Store Wages Cause It?
Many people blame store workers getting higher pay. In states like California, a new law set fast-food worker pay to at least $20 per hour (UC Berkeley IRLE).
Did that force burritos to cost $20?
Researchers at UC Berkeley tracked fast-food stores after the $20 wage law started. They found that stores only raised menu prices by 1.5% to 3.7% to cover the new pay (UC Berkeley IRLE). That adds about 15 cents to a meal, not $5.00!
```mermaid
flowchart LR
subgraph Legislation ["California Wage Law"]
A["Minimum Wage Hike +$4.00 / hour ($16 -> $20)"]
end
subgraph Efficiency ["Tech & Automation Productivity"]
B["Self-Order Kiosks & Mobile Shelves"]
C["Workers Assemble 2x Burritos / Hour"]
end
subgraph MenuImpact ["Final Consumer Price Impact"]
D["Actual Menu Price Hike: +15 cents (+1.5% to +3.7%)"]
end
A --> B
B --> C
C --> D
```
Why didn't higher pay ruin the stores? Because stores used technology. Apps and self-order kiosks let workers assemble more meals in less time. One worker can now make twice as many burritos per hour as they did ten years ago (NBER).
## 4. Big Chains vs. Small Local Shops
Here is the biggest secret behind food [inflation](/glossary#real-inflation).
Big restaurant chains did not just raise prices to cover their bills. They raised prices to boost their own [profit margin](/dictionary#profit-margin).
```mermaid
graph TD
subgraph Corporate ["Big Corporate Chains (e.g. Chipotle)"]
A1["Raw Food Costs: 29.6%"]
A2["Store Labor Costs: 25.0%"]
A3["Operating Margin: 25.4% (EXPANDED PROFIT MARGIN)"]
end
subgraph Independent ["Independent Family Taquerias"]
B1["Raw Food Costs: 32.4%"]
B2["Store Labor Costs: 31.7%"]
B3["Operating Margin: 2.8% to 4.0% (SURVIVAL MODE)"]
end
Corporate -->|"Pricing Power & Scale"| A3
Independent -->|"Rising Rent & Input Costs"| B3
```
| Business Type | Average Profit Margin | What Happened to Their Profits |
| :----------------------------- | :-------------------- | :------------------------------------ |
| **Big Chains (e.g. Chipotle)** | 25.4% | **Grew bigger** (Up from 21% in 2019) |
| **Local Family Taquerias** | 2.8% to 4.0% | **Struggled to survive** |
Big corporate chains had the power to charge higher prices while keeping food and labor costs lower as a percentage of sales (Chipotle SEC 10-K). In 2024 and 2025, major fast-food brands bought back billions of dollars of their own stock with extra profits.
Meanwhile, small neighborhood restaurants had to raise prices just to stay open. They don't have app algorithms or massive bulk discounts.
## The Seagull's Take
The $20 burrito is an illusion created by convenience. In a real store, lunch costs about $11. On a phone app, it costs $22 because you are paying for software, drivers, and platform fees.
Big food companies took advantage of [fiat currency](/glossary#fiat-currency) debasement to hike prices and widen their profits. Small family shops raised prices just to keep their lights on.
The Seagull does not chase shiny food delivery apps. The Seagull swoops in to grab the raw facts before the rest of the flock gets plucked. If you want to protect your [purchasing power](/glossary#currency-debasement), hold [hard assets](/glossary#hard-asset), watch real data, and walk to the store yourself.
### Works Cited
Chipotle Mexican Grill, Inc. _Form 10-K Annual Report for the Fiscal Year Ended December 31, 2024_. U.S. Securities and Exchange Commission, Feb. 2025, [https://www.sec.gov](https://www.sec.gov).
Chipotle Index Team. "Chipotle Index: Regional Menu Price Data & Extremes." _Chipotle Index_, 2026, [https://chipotleindex.com/data](https://chipotleindex.com/data).
DoorDash, Inc. _Understanding Delivery Pricing and Fee Structures: A 26-Month Consumer Study_. SimplyCodes Research, 2026.
Reich, Michael, et al. _Effects of the $20 California Fast-Food Minimum Wage: Employment, Prices, and Worker Welfare_. Institute for Research on Labor and Employment, University of California, Berkeley, Feb. 2025, [https://irle.berkeley.edu](https://irle.berkeley.edu).
Syverson, Chad, et al. _The Curious Surge of Productivity in U.S. Restaurants_. National Bureau of Economic Research, Working Paper No. 33555, 2025, [https://www.nber.org](https://www.nber.org).
United States Department of Agriculture (USDA) Economic Research Service. _Food Price Outlook: Summary Findings_. USDA, July 2026, [https://www.ers.usda.gov](https://www.ers.usda.gov).
---
### The 3% Mortgage Prison: Why Nobody Can Sell Their House
*Canonical URL: https://glassseagull.com/blog/the-3-percent-mortgage-prison*
*Date: OCT 17, 2026 | Category: Housing & Real Estate*
### Key Takeaways & Executive Summary
- **Q: Why did the American housing market freeze in 2026?**
- **A: Over 60% of homeowners locked in fixed mortgage rates below 4% during 2020 and 2021. Today, new mortgages cost over 7%. Trading an existing home for an identical house costs an extra $780 every month in pure interest penalty.**
- **Q: Why do home prices stay high despite 7% mortgage rates?**
- **A: Supply vanished faster than buyers. Because existing owners refuse to sell, homes for sale dropped by 40% compared to peak years. The few buyers left must fight over a tiny handful of houses.**
---
Most people expect housing prices to drop when interest rates climb.
That rule works in normal times. If borrowed money costs more, buyers borrow less cash. Sellers lower their prices to find a buyer.
Right now, that rule lies broken on the floor.
Mortgage rates jumped from 3% to over 7%. Yet home prices, tracked by the [Case-Shiller Home Price Index](https://fred.stlouisfed.org/series/CSUSHPINSA), sit near record highs. Millions of young families cannot afford to buy. Millions of older families want to move, but they stay put.
The Seagull does not look at emotional real estate commercials. The Seagull tracks the hard math. Here is why the American housing market built its own prison, and who holds the keys.
## 1. The Math of the Golden Handcuffs
Between 2020 and 2021, the Federal Reserve pumped trillions of dollars into banks through [quantitative easing](/glossary#quantitative-easing). Mortgage rates dropped below 3%.
Millions of Americans bought houses or refinanced old debt. Data from the Federal Housing Finance Agency (FHFA) shows that 57% to 63% of all active American mortgages carry a fixed rate below 4.0%.
Then consumer prices surged. The central bank slammed on the brakes. The 30-year mortgage rate spiked above 7.0% (FRED series `MORTGAGE30US`).
Look at what happens to a normal family buying a median $400,000 home with 20% down ($80,000 cash down, $320,000 loan):
| Monthly Expense Component | Old 3.0% Loan (2021) | New 7.0% Loan (2026) | Extra Monthly Cost | Jump in Cost |
| :------------------------------ | :------------------- | :------------------- | :----------------- | :----------- |
| **Principal & Interest** | $1,349.13 | $2,128.97 | +$779.84 | +57.8% |
| **Property Taxes (1.2%)** | $400.00 | $400.00 | $0.00 | 0.0% |
| **Home Insurance** | $150.00 | $150.00 | $0.00 | 0.0% |
| **Total Monthly House Payment** | **$1,899.13** | **$2,678.97** | **+$779.84** | **+41.1%** |
| **Annual Cash Cost** | **$22,789.56** | **$32,147.64** | **+$9,358.08** | **+41.1%** |
If this family sells their house and buys the exact same house across the street, their monthly payment leaps by $780 every month. That burns $9,358 in extra cash every single year.
Over 30 years, that cheap 3% mortgage note saves them over $117,000 in cash value.
Nobody throws $117,000 in the garbage on purpose. Incumbent owners keep their old loans. They lock their doors, put away the "For Sale" sign, and refuse to move.
## 2. Why Prices Defy Gravity
Many people expected a 2008-style housing crash. It never arrived.
In 2008, millions of borrowers carried adjustable-rate loans with zero down payments. When rates rose, their monthly bills spiked automatically. Defaults flooded the market with foreclosures.
Today, over 96% of borrowers hold fixed-rate loans. Higher market rates do not change their existing monthly payment. Instead of creating forced sellers, higher rates wiped out voluntary sellers.
Data from the National Association of Realtors (FRED series `EXHOSLUSM495S`) shows existing home sales collapsed to 3.99 million houses per year. That matches the lowest sales volume seen since the Great Financial Crisis.
Research by the FHFA uncovered the secret:
- Higher interest rates destroyed buyer demand, pushing prices down by 3.3% to 5.6%.
- But higher interest rates destroyed seller inventory even faster, pushing prices up by 5.7% to 7.0%.
The supply freeze beat the demand drop. Because almost nobody lists their house, buyers must fight over scraps. Prices refuse to fall.
## 3. The Downsizing Trap and Trapped Workers
The housing prison harms more than just buyers. It warps the whole economy.
Consider older couples whose children moved out. In normal times, they sell their four-bedroom suburban house and buy a small two-bedroom apartment or single-story cottage. That frees up the family house for young parents.
Today, downsizing costs more money. If an older couple sells a paid-off or 3% house to buy a smaller condo at 7%, their monthly cost jumps. Millions of empty-nesters choose to stay in houses that fit five people.
Young families cannot buy those large houses. They stay trapped in starter homes. First-time buyers cannot find starter homes. The entire ladder broke.
Work suffers too. A landmark study from the National Bureau of Economic Research (NBER) by researchers Julia Fonseca and Lu Liu showed that the mortgage lock-in cut moving rates among mortgage holders by 25% to 29%.
When a company in Texas or North Carolina offers a worker in Ohio a 15% raise, that worker must say no. Taking the new job means selling a 3% mortgage and buying a 7% mortgage. The extra housing cost wipes out the wage gain. Human talent stays stuck in place.
## 4. Big Builders Win the Monopoly
While neighborhood families stay trapped, giant corporate homebuilders stepped into the empty market.
Companies like D.R. Horton and Lennar now build over 40% of all new houses in America. They run their own in-house mortgage companies.
Because corporate builders earn large profit margins on raw land and construction, they offer a special trick called a mortgage rate buydown. The builder pays upfront fees to the bank so the buyer gets a special 4.5% or 3.99% rate.
A regular homeowner selling an existing home cannot pay $25,000 out of pocket to lower a buyer's interest rate. Corporate builders do it every day. As a result, new home supply (FRED series `MSACSR`) climbed to 8.5 months, while existing homes remain starved.
Meanwhile, trapped homeowners tap their home equity without selling. Federal Reserve data shows revolving home equity loans (FRED series `RHEACBW027SBOG`) surged to $291 billion. Instead of moving, owners borrow against their houses to build backyard offices and remodel kitchens.
## The Seagull's Take
The 3% mortgage lock-in is a classic case of [financial repression](/glossary#financial-repression).
The central bank gave cheap money to the flock in 2020. Now that cheap money acts like a steel chain. It ties workers to their zip codes, blocks young couples from building wealth, and hands total market power to corporate homebuilders.
Do not wait for a sudden crash in nominal home prices. Unless millions of people lose their jobs at once, owners will protect their 3% rates with their lives.
The Seagull does not chase overpriced suburban bidding wars. If you want to protect your [purchasing power](/glossary#currency-debasement), look at real math. Avoid high-interest consumer debt, track raw supply, and build your foundation in [hard assets](/glossary#hard-asset) that no bank or central planner can lock down.
### Works Cited
Batzer, Ross, et al. _Working Paper 24-03: The Lock-In Effect of Rising Mortgage Rates_. Federal Housing Finance Agency, 18 Mar. 2024, [https://www.fhfa.gov/research/papers/wp2403](https://www.fhfa.gov/research/papers/wp2403).
Board of Governors of the Federal Reserve System. "Revolving Home Equity Loans, All Commercial Banks [RHEACBW027SBOG]." _FRED, Federal Reserve Bank of St. Louis_, 9 Oct. 2026, [https://fred.stlouisfed.org/series/RHEACBW027SBOG](https://fred.stlouisfed.org/series/RHEACBW027SBOG).
Fonseca, Julia, and Lu Liu. "Mortgage Lock-In, Mobility, and Labor Reallocation." _NBER Working Paper No. 26666_, National Bureau of Economic Research, 2024, [https://www.nber.org/papers/w26666](https://www.nber.org/papers/w26666).
Fonseca, Julia, Lu Liu, and Pierre Mabille. "Unlocking Mortgage Lock-In: Equilibrium Effects in a Spatial Housing Ladder Model." _NBER Working Paper No. 35237_, National Bureau of Economic Research, May 2026, [https://www.nber.org/papers/w35237](https://www.nber.org/papers/w35237).
Freddie Mac. "30-Year Fixed Rate Mortgage Average in the United States [MORTGAGE30US]." _FRED, Federal Reserve Bank of St. Louis_, 24 Sep. 2026, [https://fred.stlouisfed.org/series/MORTGAGE30US](https://fred.stlouisfed.org/series/MORTGAGE30US).
National Association of Realtors. "Existing Home Sales [EXHOSLUSM495S]." _FRED, Federal Reserve Bank of St. Louis_, 13 Oct. 2026, [https://fred.stlouisfed.org/series/EXHOSLUSM495S](https://fred.stlouisfed.org/series/EXHOSLUSM495S).
S&P Dow Jones Indices LLC. "S&P CoreLogic Case-Shiller U.S. National Home Price Index [CSUSHPINSA]." _FRED, Federal Reserve Bank of St. Louis_, 16 Oct. 2026, [https://fred.stlouisfed.org/series/CSUSHPINSA](https://fred.stlouisfed.org/series/CSUSHPINSA).
U.S. Census Bureau and U.S. Department of Housing and Urban Development. "Monthly Supply of New Houses in the United States [MSACSR]." _FRED, Federal Reserve Bank of St. Louis_, 24 Sep. 2026, [https://fred.stlouisfed.org/series/MSACSR](https://fred.stlouisfed.org/series/MSACSR).
---
### The 'Can It Run Doom?' Index: 33 Years of Silicon vs. Fiat Money
*Canonical URL: https://glassseagull.com/blog/the-can-it-run-doom-index*
*Date: OCT 17, 2026 | Category: Macro Telemetry*
### Key Takeaways & Executive Summary
- **Q: Why does running Doom teach us about money and inflation?**
- **A: Governments print trillions of paper dollars, driving up the cost of houses, food, and doctor visits. Computer chip makers fight back by cramming twice as many transistors onto silicon chips, driving real prices down.**
- **Q: Did gaming computers get cheaper or more expensive over 33 years?**
- **A: In real purchasing power, gaming rigs collapsed in price. A smooth rig cost $3,669 in 1993 dollars. Today, a smooth rig for Doom: The Dark Ages costs $1,702, cutting the real barrier by over 53 percent.**
- **Q: Can chip technology always defeat money printing?**
- **A: No. Between 2020 and 2022, massive money printing and broken supply chains pushed graphics card prices through the roof, temporarily beating silicon deflation.**
---
### The One Question That Explains the Economy
Gamers share one famous joke: _"Can it run Doom?"_
People have forced id Software's classic demon shooter to run on digital pregnancy tests, ATM screens, smart refrigerators, and lawnmowers.
Yet back in December 1993, running Doom demanded serious wealth. The game demanded a 32-bit microprocessor, four whole megabytes of memory, and a color VGA glass monitor.
Over the next 33 years, central banks printed trillions of brand-new paper bills. That flood of paper cash pushed the price of single-family homes, ribeye steaks, healthcare, and college tuition into the stratosphere.
Yet during that exact same window, the real cost to step into Doom's digital worlds tumbled down a cliff.
The battle between microchips and paper currency puts the two biggest forces in economics on full display:
1. **Monetary Dilution**: Central banks print paper notes, diluting the purchasing power of every dollar you earn.
2. **Technological Deflation**: Computer engineers shrink transistors, packing double the horsepower into microscopic silicon wafers every two years.
To track this battle, we examined 38 Doom releases across three decades. We matched launch-month hardware requirements against retail catalog archives and official Bureau of Labor Statistics inflation data.
The numbers reveal an unmistakable truth: silicon beat the printing press.
---
### The 33-Year Doom Telemetry Chart
The interactive chart below tracks the complete all-in cost to build or purchase a desktop computer for each mainline Doom PC release. Every figure includes the full computer tower, a color monitor, a keyboard, a mouse, and an official operating system license, adjusted to October 2026 purchasing power using official CPI-U data.
---
### 33 Years of the Doom Hardware Matrix
The table below splits hardware costs into two distinct real-world tiers:
- **Practical Playable Spec**: The setup recommended by developers and tech magazines to run the game smoothly with rich visuals.
- **Bare-Minimum Spec**: The cheapest configuration that booted the software, often requiring low resolutions, choppy frame rates, and technical compromises.
| Game Release | Launch Date | Bare-Minimum Real Cost | Practical Playable Real Cost | Primary Silicon Upgrade Driver |
| :---------------- | :----------- | :------------------------ | :------------------------------------ | :------------------------------------------------------------------- |
| **Doom** | Dec 10, 1993 | $2,749 (Zeos 486SX-25) | **$3,669** (486DX2-66, 8MB) | CPU software render; 3.7MB DOS conventional memory limit. |
| **Doom II** | Sep 30, 1994 | $3,127 (486DX-33) | **$3,575** (486DX2-66, 8MB) | Doubled demon density; 8MB RAM becomes mandatory standard. |
| **Doom 3** | Aug 3, 2004 | $880 (P4 Budget OEM) | **$2,639** (P4 3.2GHz, 6800 GT) | Programmable shaders; dynamic stencil shadows killed older cards. |
| **Doom (Reboot)** | May 13, 2016 | $969 (Core i5, GTX 670) | **$1,315** (Core i5, GTX 960) | Vulkan API multi-threading eliminated CPU bottleneck walls. |
| **Doom VFR** | Dec 1, 2017 | $2,125 (Core i5 + VR) | **$2,847** (Core i7, GTX 1080 + Vive) | 90 FPS stereoscopic demand plus a mandatory $600 SteamVR helmet tax. |
| **Doom Eternal** | Mar 20, 2020 | $968 (Ryzen 3, RX 570) | **$1,425** (Ryzen 5, 1660 Ti) | Apex Vulkan software efficiency before pandemic supply shocks. |
| **The Dark Ages** | May 15, 2025 | $1,007 (Ryzen 7, RX 6600) | **$1,702** (Ryzen 7, RTX 3080) | Mandatory hardware ray tracing and NVMe direct streaming. |
---
### Epoch I: The 1993 MS-DOS Memory Panic
In December 1993, id Software uploaded Doom shareware to an FTP server at the University of Wisconsin. Computer networks across universities and office buildings ground to a halt.
Yet you could not run Doom on an everyday family typewriter. The game relied on pure CPU horsepower. Computer graphics cards had no 3D processing chips. The central processor had to compute every single wall texture, lighting gradient, and demon sprite by itself.
More brutally, the game hit the brick wall of MS-DOS conventional memory.
MS-DOS reserved the bottom 640 kilobytes of system memory for internal operating system code. Doom required roughly 3.7 megabytes of free memory to boot. Gamers who owned basic 4-megabyte machines spent hours editing text configuration files (`config.sys` and `autoexec.bat`). They had to disable their hard drive speed caches (`smartdrv.exe`) and boot with bare-metal diskettes just to scrape together enough RAM.
Contemporaneous computer catalogs reveal the steep financial barrier:
- A bare-bones Zeos desktop with a weak 486SX-25 processor and 4MB of RAM cost **$1,195** in early 1994. In today's money, that bare-minimum machine cost **$2,749**.
- A practical, fluid machine featuring an Intel 486DX2/66 processor, 8MB of high-speed RAM, a 540MB hard drive, and a 14-inch SVGA color monitor cost **$1,595**.
- In October 2026 purchasing power, that recommended machine cost **$3,669**.
To slay demons in 1993, an everyday worker had to surrender two full months of take-home pay.
By autumn 1994, id Software released _Doom II: Hell on Earth_. The sequel packed larger levels and swarms of monsters. The game manual warned players that trying to run on 4MB of RAM was now done "strictly at your own risk." Eight megabytes became the non-negotiable floor.
---
### Epoch II: The 2004 Programmable Shader Massacre
In August 2004, id Software dropped _Doom 3_. The release caused an earthquake across the computer hardware industry.
Previous games drew flat pictures and slapped static lightmaps over polygons. _Doom 3_ ripped out those old shortcut techniques. Lead programmer John Carmack built an engine around programmable shaders, calculating dynamic per-pixel lighting and real-time stencil shadows. Every swinging lightbulb cast realistic black shadows across demon horns.
This mathematical leap triggered a hardware massacre:
- The most popular budget graphics card in homes across America, the NVIDIA GeForce 4 MX, could not compute programmable shaders. It lacked the silicon circuits required by DirectX 9.0b.
- Millions of family computers became obsolete for gaming overnight.
- Players needed dedicated graphics accelerators like the ATI Radeon 8500 or NVIDIA GeForce 3.
To experience the game as Carmack designed it, enthusiasts flocked to the monstrous NVIDIA GeForce 6800 GT. A complete enthusiast desktop sporting a 3.2 gigahertz Pentium 4, 512MB of RAM, a high-refresh CRT screen, and a 6800 GT graphics card commanded **$1,500 nominal**, or **$2,639 in 2026 purchasing power**.
Yet notice the broader deflationary trend: while visual complexity jumped a hundredfold, the real cost of a recommended rig had already dropped from $3,669 down to $2,639.
---
### Epoch III: The Vulkan API and the 2017 VR Hardware Tax
By May 2016, the Do-It-Yourself computer building market had reached full maturity. Enthusiasts stopped buying prebuilt office towers and began assembling individual parts.
The 2016 _Doom_ reboot delivered a software miracle: the **Vulkan API**.
Older game engines forced one single CPU core to handle all communication with the graphics card. Vulkan smashed that single-thread wall. It distributed drawing commands across all CPU cores simultaneously.
Suddenly, an affordable quad-core Intel Core i5 or AMD FX processor paired with a budget GTX 960 graphics card delivered buttery 1080p action for just **$950 nominal**, or **$1,315 real**.
Then came December 2017: _Doom VFR_.
Virtual reality broke the downward cost trend by imposing an aggressive hardware tax:
- VR demands two separate screens rendered at 90 frames every second to stop players from feeling motion sick.
- The software demanded heavy-duty graphics cards like the GTX 1070 or GTX 1080.
- Crucially, players had to purchase an HTC Vive headset kit for **$600**.
That mandatory headset pushed the all-in practical setup cost to **$2,100 nominal**, or **$2,847 in 2026 dollars**. When a new technology demands fresh physical glass lenses and motion sensors, the hardware bill climbs back toward 1990s levels.
---
### Epoch IV: The 2025 Path-Tracing Floor
In March 2020, _Doom Eternal_ pushed software optimization to its peak. A custom DIY desktop using an AMD Ryzen 3 2200G and an RX 570 graphics card cost just **$494 for tower parts**, or **$754 all-in with monitor and Windows**. In real terms, that equaled **$968**, marking the lowest entry floor in gaming history.
Mere weeks later, the global pandemic and monetary printing press collided.
Between March 2020 and 2022, the Federal Reserve inflated the M2 money supply by over 40 percent. Global factories paused. Crypto miners and scalpers bought every graphics chip on the market. By March 2021, when _The Ancient Gods - Part Two_ arrived, replacement graphics cards cost double their retail sticker price, temporarily driving the budget entry price back up to **$1,380 real**.
Yet silicon resumed its deflationary march.
On May 15, 2025, id Software launched _Doom: The Dark Ages_.
The developers established two permanent technical requirements:
1. **Mandatory Hardware Ray Tracing**: You cannot disable ray tracing in settings. Fundamental combat mechanics, including shield parrying and bullet trajectories, calculate intersections using hardware ray mathematics. This requirement permanently disqualified budget APU chips that lack ray-tracing accelerators.
2. **Direct NVMe Solid-State Streaming**: The game requires 100 gigabytes of high-speed solid-state storage. Mechanical hard drives have been permanently retired from gaming.
Now examine the real economic cost:
- Hitting the bare-minimum ray-tracing floor in 2025 requires a Ryzen 7 processor and a dedicated Radeon RX 6600 graphics card. The complete setup costs **$976 nominal**, or **$1,007 in 2026 real dollars**.
- Building a high-end 1440p practical setup with a Ryzen 7 5700X, 32GB of RAM, and an RTX 3080 costs **$1,650 nominal**, or **$1,702 in 2026 real dollars**.
```
PRACTICAL PLAYABLE SETUP COST (REAL 2026 $):
1993 Doom (486DX2-66, 8MB RAM): $3,669 ████████████████████
1994 Doom II (486DX2-66, 8MB RAM): $3,575 ███████████████████
2004 Doom 3 (P4 3.2GHz, 6800 GT): $2,639 ██████████████
2016 Doom Reboot (Core i5, GTX 960): $1,315 ███████
2017 Doom VFR (Core i7 + Vive Tax): $2,847 ███████████████
2020 Doom Eternal (Ryzen 5, 1660 Ti): $1,425 ████████
2025 The Dark Ages (Ryzen 7, RTX 3080):$1,702 █████████ (-53.6%)
```
---
### What Doom Teaches Us About Human Wealth
Mainstream financial reports treat inflation like an unavoidable law of nature. Economists tell you that everything must cost more tomorrow than it does today.
The Doom Hardware Index proves that story is false.
Prices only climb when humans cannot create new goods faster than central banks print new paper notes.
- You cannot print land in Manhattan, so home prices rise.
- You cannot print surgeons, so medical bills climb.
- You cannot print farmland, so ribeye steak prices jump.
Yet human engineers can build faster machines. Over three decades, microchip architects found ways to etch billions of microscopic pathways onto a square inch of sand. That ingenuity outpaced the global printing press for 33 years straight.
In 1993, stepping into Doom demanded two months of your labor. Today, silicon deflation delivers thirty-two times more pixels and four thousand times more memory for less than half the real cost.
---
### Works Cited (MLA 9th Edition)
Bethesda Softworks. "DOOM Eternal Launch Details and PC System Requirements." _Bethesda.net_, 10 Mar. 2020, [https://bethesda.net/en-US/news/doom-eternal-launch-details](https://bethesda.net/en-US/news/doom-eternal-launch-details).
Bethesda Softworks. "DOOM: The Dark Ages PC System Requirements." _Slayers Club_, 2025, [https://slayersclub.bethesda.net/en-US/news/doom-the-dark-ages-pc-specs](https://slayersclub.bethesda.net/en-US/news/doom-the-dark-ages-pc-specs).
Byte Magazine. "ComponentWare and System Pricing." _Byte Magazine_, May 1994, [https://vintageapple.org/byte/pdf/199405_Byte_Magazine_Vol_19-05_ComponentWare.pdf](https://vintageapple.org/byte/pdf/199405_Byte_Magazine_Vol_19-05_ComponentWare.pdf).
Computer History Museum. "August 2004 Semiconductor Price Tracking." _Computer History Museum_, Nov. 2023, [https://archive.computerhistory.org/resources/access/text/2023/11/102803734-05-009-acc.pdf](https://archive.computerhistory.org/resources/access/text/2023/11/102803734-05-009-acc.pdf).
id Software. "DOOM II: Hell on Earth Addendum and Manual." _id Software / GT Interactive_, Sept. 1994, [https://www.scribd.com/document/417949726/Doom-2-Addendum](https://www.scribd.com/document/417949726/Doom-2-Addendum).
Level1Techs. "Budget Gaming in Late 2024: Hardware Buyer Advice." _Level1Techs Forum_, Oct. 2024, [https://forum.level1techs.com/t/700-budget-gaming-in-late-2024-buyer-advice-from-wertigon/220562](https://forum.level1techs.com/t/700-budget-gaming-in-late-2024-buyer-advice-from-wertigon/220562).
Miller, Greg. "Personal Computers: Fast 486 Machines Reach $1,000 Threshold." _Los Angeles Times_, 23 Dec. 1993, [https://www.latimes.com/archives/la-xpm-1993-12-23-fi-4940-story.html](https://www.latimes.com/archives/la-xpm-1993-12-23-fi-4940-story.html).
Newb Computer Build. "Budget Gaming PC Builds of the Month: March 2020." _Newb Computer Build_, Mar. 2020, [https://newbcomputerbuild.com/gaming-pc-builds-of-the-month/march-2020-gaming-pc-builds-of-the-month-1500-1000-700-500/](https://newbcomputerbuild.com/gaming-pc-builds-of-the-month/march-2020-gaming-pc-builds-of-the-month-1500-1000-700-500/).
PC Computing. "Volume 7 Issue 6: System Price Logs." _PC Computing Magazine_, June 1994, [https://archive.org/stream/pc-computing-magazine-v7i6/pc-computing-magazine-v7i6_djvu.txt](https://archive.org/stream/pc-computing-magazine-v7i6/pc-computing-magazine-v7i6_djvu.txt).
PC World. "Contemporaneous PC Retail Catalog Archives: Zeos and Gateway 2000." _PC World Magazine_, Jan.-Apr. 1994, [https://archive.org/stream/pcworld124unse/pcworld124unse_djvu.txt](https://archive.org/stream/pcworld124unse/pcworld124unse_djvu.txt).
PCGamingWiki. "DOOM (1993) System Requirements and Engine Specifications." _PCGamingWiki_, 2024, [https://www.pcgamingwiki.com/wiki/Doom\_(1993)]().
Reddit r/buildapc. "Budget PC Build Guide: Ryzen 5 5600 + RX 6600." _Reddit_, Nov. 2022, [https://www.reddit.com/r/buildapc/comments/yn61fk/budget_pc_build_for_you_all_ryzen_5600_rx_6600/](https://www.reddit.com/r/buildapc/comments/yn61fk/budget_pc_build_for_you_all_ryzen_5600_rx_6600/).
Steam Community. "DOOM VFR Release FAQ and Hardware Requirements." _Valve Corporation / Bethesda_, Dec. 2017, [https://steamcommunity.com/games/650000/announcements/detail/1468600687467782898](https://steamcommunity.com/games/650000/announcements/detail/1468600687467782898).
United States Bureau of Labor Statistics. "Consumer Price Index for All Urban Consumers: All Items in U.S. City Average (CPI-U)." _U.S. Department of Labor_, Oct. 2026, [https://www.bls.gov/cpi/](https://www.bls.gov/cpi/).
VOGONS. "Contemporaneous Hardware System Benchmarks: Doom 3 and GeForce 4 MX Obsolescence." _Vogons Community_, Aug. 2004, [https://www.vogons.org/viewtopic.php?t=40679](https://www.vogons.org/viewtopic.php?t=40679).
---
### The Econometrics of the Dollar Menu (2014–2026)
*Canonical URL: https://glassseagull.com/blog/the-econometrics-of-the-dollar-menu*
*Date: JUN 29, 2026 | Category: Macro Telemetry*
### Key Takeaways & Executive Summary
- **Q: What is the "Burgers Per Hour" (BPH) metric and why does the Glass Seagull framework prioritize it over CPI-U?**
- **A: BPH is a real-world unit of account measuring how many standardized fast-food items (McDouble/Double Cheeseburger) an hour of median labor can buy. We prioritize it because CPI-U includes highly abstracted, hedonic-adjusted categories (like technology and medical services) that mask the severe price inflation of immediate, non-discretionary daily necessities.**
- **Q: How does the "lock-in" of statutory wages affect regional purchasing power under the Burger Standard?**
- **A: In states defaulting to the federal minimum wage ($7.25 since 2009), real BPH purchasing power collapsed by over 67% from 2014 to 2026. Even in states with inflation-indexed minimum wages (like Washington), BPH purchasing power still declined by 40%, demonstrating that official inflation indexing lags behind real-world commodity and operational price shocks.**
---
Macroeconomic analysts love to hide behind the Consumer Price Index (CPI-U).
The Bureau of Labor Statistics will look you in the eye and tell you that the cumulative inflation rate between June 2014 and May 2026 was approximately **36.44%**. They will tell you the algorithms have calibrated the basket, adjusted for quality, and determined that the dollar is doing just fine.
But the Seagull doesn't fly in the clouds of abstract statistics. We look at the ground.
For the average working-class household, standard inflation baskets are a mirage. They include hedonic adjustments for flat-screen TVs and new cars, while ignoring the compounding cost of immediate, daily survival. To find the true rate of currency debasement, we must establish a more visceral unit of account: **The Burger Standard**.
By measuring the **Burgers Per Hour (BPH)** metric (how many standardized McDoubles or Double Cheeseburgers one hour of labor can secure), we can bypass the statistical smoothing of the state and measure the raw erosion of American purchasing power.
$$\text{BPH} = \frac{\text{Hourly Wage}}{\text{Price of Burger}}$$
---
## The Empirical Collapse: Wages vs. The Griddle
To understand the scale of the erosion, we must contrast nominal wage growth against the price of the most standardized calorie delivery systems on the planet: the McDonald's McDouble and Double Cheeseburger.
In 2014, a McDouble cost **$1.19**. By mid-2026, the non-promotional price for that same sandwich had climbed to **$3.65**, a staggering **206.72% price increase**.
During this exact same 12-year window:
- **Average Private Hourly Earnings** (FRED: `CES0500000003`) grew from $24.46 to $37.53, an increase of **53.43%**.
- **The National Median Hourly Wage** (representing the actual middle of the labor force) grew from $17.09 to $24.51, a modest **43.42%** increase.
### Nominal Cumulative Growth Rates (2014–2026)
```text
McDouble Retail Price: ██████████████████████████████ (206.72%)
Double Cheeseburger Price: ████████████████████████ (163.52%)
Average Private Hourly Wage: ████████ (53.43%)
National Median Hourly Wage: ██████ (43.42%)
Official CPI-U General Index: █████ (36.44%)
```
The divergence is mathematical proof of a declining standard of living.
In 2014, a median-wage earner could exchange one hour of life for **14.36 McDoubles**. By 2026, that same hour of labor secured just **6.72 McDoubles**, a **53.20% collapse in real purchasing power**.
Even the higher-paid cohort of private-sector employees wasn't spared. The mean private earner saw their McDouble BPH drop from **20.55** to **10.28** (a 49.98% decline).
When the cost of basic food triples while wages grow by half, the "wealth" of the working class is not growing. It is being silently harvested by currency debasement.
---
## Regional Divergence: The Illusion of the Safety Net
The national average hides the localized trauma. Because the federal minimum wage has remained frozen at **$7.25 per hour since 2009**, the geographical reality of a worker determines their level of economic survival.
Let's look at the telemetry comparing Washington State (inflation-indexed minimum wage) to Georgia (defaulting to the federal baseline).
### Regional Labor Policy Framework (2014 vs. 2026)
| Region / Policy | 2014 Min. Wage | 2026 Min. Wage | Nominal Wage Growth | 2014 McDouble BPH | 2026 McDouble BPH | Net Real BPH Change |
| :-------------------------------- | :------------: | :------------: | :-----------------: | :---------------: | :---------------: | :-----------------: |
| **Washington State** (Indexed) | $9.32/hr | $17.13/hr | +83.80% | 7.83 | 4.69 | **-40.10%** |
| **Georgia** (Cobb County Federal) | $7.25/hr | $7.25/hr | 0.00% | 6.09 | 1.99 | **-67.32%** |
| **Cobb County** (Market Reality) | $7.50/hr | $11.50/hr | +53.33% | 6.30 | 3.15 | **-50.00%** |
### The Washington Cushion
Washington State indexes its minimum wage annually to the CPI-W. This policy pushed their statutory floor from $9.32 in 2014 to $17.13 in 2026 (+83.80%). Yet, even this aggressive indexing was outrun by the menu. A minimum-wage worker in Seattle still saw their real-world burger purchasing power decline by **40.10%**. The index is a shield, but the griddle is a sword.
### The Georgia Default
In Cobb County, Georgia, where the legal minimum wage defaults to the federal $7.25, the collapse is catastrophic. An hour of minimum-wage labor in 2014 bought 6 McDoubles. Today, it buys **1.99**.
### The Market Reality Offset
Defenders of the status quo point out that market competition has forced actual starting wages in Cobb County up to **$11.50/hr** (+53.33%). But even this market-driven wage increase was entirely eaten by the menu. In 2014, a starting worker could buy 6.30 McDoubles per hour. In 2026, they buy **3.15**, an exact **50.00% reduction** in real earnings.
No matter how hard the market tries to adjust nominal wages, the rate of price increases in the real economy completely neutralizes the gains.
---
## Supply-Side Undercurrents: The Microeconomics of a McDouble
Why have fast-food prices risen 4x faster than the official CPI? To understand, we must dissect the raw input cost of a McDouble in 2026.
### Raw Ingredient Cost Breakdown (2026 Estimate)
| Input Component | Commercial Unit Cost | Raw Cost Contribution |
| :-------------------------------------------- | :-------------------------- | :-------------------: |
| **All-Beef Patties** (Two 1.6 oz. pre-cooked) | $5.00 / lb wholesale | $1.25 |
| **Enriched Bun** (Standard sesame/plain) | $2.99 / 4-pack retail basis | $0.75 |
| **American Cheese** (One slice) | $2.99 / 16-slice pack | $0.19 |
| **Pickles & Onion** (Dehydrated & Pickled) | Bulk wholesale average | $0.31 |
| **Condiments** (Ketchup, Mustard, Seasoning) | Bulk wholesale average | $0.08 |
| **Total Raw Ingredient Cost** | N/A | **$2.58** |
A raw cost of **$2.58** against a retail price of **$3.65** reveals a tight gross margin of **29%**.
This markup must absorb the massive rise in commercial overhead: retail rent, commercial property insurance (up 40% since 2020), utility costs, and franchise royalties. When utility rates and shipping costs spike, the franchisee has no choice but to pass the cost directly to the consumer. The griddle is simply reflecting the reality of the supply chain.
---
## Corporate Strategy: The Illusion of Value
As sales volumes stall in 2026 due to the squeezed consumer, corporate brands have shifted from outright price hikes to **Menu Architecture**, a polite term for psychological pricing and shrinkflation.
On April 21, 2026, McDonald’s introduced the national **"Under $3 Menu"** to capture headlines. But look closer.
Previously, the popular **"Buy One, Get One for $1" (BOGO)** deal allowed a consumer to buy two Double Cheeseburgers for **$4.49**. Under the new "Under $3 Menu," the BOGO promotion is gone. Buying two McDoubles (which contain less cheese than the Double Cheeseburger) now costs **$5.00**.
### Price Impact of Menu Restructuring
```text
Old BOGO Promotion: █████████████████████████ ($4.49 for 2 Double Cheeseburgers)
New Under $3 Menu: ████████████████████████████ ($5.00 for 2 McDoubles)
[+11.39% Price Increase & Less Cheese]
```
This is the definition of **Shrinkflation**. You pay 11.39% more, and you get less cheese. The brand gets to market "affordability" while actively raising the cost per calorie.
---
## The Seagull's Verdict
The Burger Standard reveals what the official CPI attempts to hide: **the working-class safety margin has been completely erased.**
When an hour of median labor buys half as many basic calories as it did a decade ago, consumers are forced to make hard choices. This is why quick-service restaurant volumes are declining. The consumer isn't "voting with their feet." They are simply out of money.
Until nominal wages are backed by true productivity gains and stabilized input costs, pay increases are nothing more than a numerical illusion. The number on your paycheck is growing, but the signal above the noise is clear: **you are working twice as hard for the same burger.**
---
### Commercial Real Estate's 40-Year Tailwinds Reversed
*Canonical URL: https://glassseagull.com/blog/the-40-year-debt-supercycle*
*Date: JUL 25, 2026 | Category: Macro*
### Key Takeaways & Executive Summary
- **Q: How does the U.S. 10-Year Treasury yield affect Commercial Real Estate?**
- **A: The 10-Year Treasury yield is the foundation of borrowing costs and cap rates. A 40-year secular decline in yields artificially inflated property values. The recent rapid spike in yields reverses this, putting immense downward pressure on commercial real estate valuations.**
---
I don't think the average person understands how much the U.S. 10-Year Treasury yield impacts commercial real estate pricing.
Look at this chart recently highlighted by StripMallGuy on LinkedIn:
### The "Genius" Illusion
For 40 years, the U.S. 10-Year Treasury yield was on a secular, unrelenting decline, falling from the high teens in the early 1980s down to near zero by 2020.
As one observer aptly noted in the comments, **"candidly, low rates for 40 years made everyone in real estate look like geniuses."**
When borrowing costs constantly decrease, property values consistently go up simply due to cap rate compression. You didn't need to be a brilliant operator to make money; you just needed to hold the asset while the Federal Reserve and the bond market provided a massive macroeconomic tailwind.
### The Generational Wealth Machine Breaks
The implications extend far beyond institutional skyscrapers. For decades, American families used this exact mechanism of steadily dropping rates to pull equity out of their homes every few years. They funded college, renovations, and investments without ever having to sell.
When rates bottomed out and were kept "dirt cheap" for too long, that mechanism was effectively stripped from the marketplace for younger generations. Now, with rising rates, the door has slammed shut.
### The Velocity of the Shock
It is true that a 4.5% Treasury yield isn't historically astronomical. If you look at the 1990s, we were significantly higher. But the real danger isn't the absolute number. It is the _velocity_ of the hike.
Underwriting models built in 2020 or 2021 rarely anticipated such rapid rate hikes. Syndicators and sponsors planned for a refinance in 5 years, assuming the macroeconomic environment would remain largely unchanged. The sudden shock breaks those models entirely.
As Cyndi Peach summarized perfectly in the discussion: _"A 4.5% Treasury is not a reason to stop buying. It is a reason to stop overpaying... Buying a 6% cap rate and praying for rate cuts is not a strategy. It is speculation wearing an Excel spreadsheet."_
As the Seagull says: _buying property on cheap debt and praying for rate cuts is just winging it on borrowed time._
The 40-year tailwind has reversed. The era of spreadsheet speculation is over. Now, we find out who actually knows how to operate real estate in a world of real [interest rates](/glossary#real-yield). When artificial credit expansion hits a sovereign ceiling, capital begins seeking tangible specie over financialized paper. This marks the timeless balance described in [David Hume's Price-Specie-Flow Mechanism](/blog/the-price-specie-flow-mechanism). Track how these debt-service milestones and Treasury refinancing pressures compound on our living [Fiscal Dominance Tracker](/trackers/fiscal-dominance).
---
### The Asset Meltdown Hypothesis: What Happens When 73 Million Boomers Sell?
*Canonical URL: https://glassseagull.com/blog/the-asset-meltdown-hypothesis*
*Date: OCT 08, 2026 | Category: Macro Demographics*
### Executive Briefing (AI Context & Direct Answer)
- **Q: What is the Asset Meltdown Hypothesis?**
- **A: The Asset Meltdown Hypothesis is an economic theory stating that as the massive Baby Boomer generation enters retirement and systematically sells off financial assets and real estate to fund living expenses, declining birth rates among younger generations will create an insufficient buyer pool. Without enough buyers, classical supply-and-demand mechanics predict prolonged downward pressure on asset values.**
- **Q: Will asset prices actually collapse?**
- **A: In nominal dollar terms, no. Because modern sovereign governments carry over $40 Trillion in debt, central banks cannot permit nominal asset deflation without triggering systemic insolvency. Instead, policymakers will deploy currency debasement and fiscal dominance. This causes asset prices to look steady or rise in dollars, while their real purchasing power in food, energy, and gold declines.**
---
Imagine a small island town.
On this island, there are 100 older people who own every house and all the fishing boats. For forty years, the houses became more expensive because everyone had good jobs and bought more boats.
Now, those 100 older people are retiring. They do not want to fish anymore. They want to sell their boats and their houses so they can buy food and medicine.
They walk down to the harbor to sell their boats.
Only 40 young people are standing on the dock.
Worse, those 40 young people only have empty pockets.
What happens to the price of the boats?
That simple story is the **Asset Meltdown Hypothesis**.
---
### The $84 Trillion Retirement Wave
Here are the real numbers behind the story.
In the United States alone, roughly **73 million Baby Boomers** are retiring.
According to data from the Federal Reserve, this single generation owns more than **$84 Trillion** in wealth. That is more than half of all the wealth in the entire country.
Most of that wealth is tied up in two things:
1. **The Stock Market** (401k plans and mutual funds)
2. **Houses** (single-family suburban real estate)
For forty years, Boomers were _net buyers_. Every two weeks, automated paychecks poured money into mutual funds. That constant buying pushed stock indexes and home prices higher and higher.
Now, that river of money has flipped direction.
Boomers are no longer buyers. They are legally required to start taking out money through Required Minimum Distributions (RMDs). Every month, they must sell stocks to pay property taxes, electric bills, assisted living costs, and health care.
---
### The Empty Harbor: The Birth-Rate Trap
Why can't the younger generation simply buy what the retirees are selling?
Because there are not enough of them, and their pockets are strapped.
Look at the birth rate:
- In 1960, the average American family had **3.6 children**.
- In 2026, the fertility rate has fallen below **1.6 children per woman**.
This creates an upside-down pyramid:
```
[ RETIREES SELLING ] ---> 73 Million people liquidating $84 Trillion
||
\/
[ YOUNG BUYERS ] ---> Smaller generation, burdened by higher living costs
```
### The Boglehead Dilemma: Why "Global Diversification" Breaks Down
A popular question recently made the rounds among index fund investors:
> _"The asset meltdown hypothesis says that as boomers retire and liquidate their portfolios, the sheer volume of selling will lower asset prices for a long time. The classic Boglehead answer is global diversification. But the birth rate problem seems to be global. How do you feel about it?"_
It is a sharp dilemma that cuts straight through standard advice.
Many investors comfort themselves by saying: _"Don't worry. Global diversification will save us. Investors in emerging markets will buy our stocks and houses."_
Look across the ocean:
- **South Korea**: Fertility rate collapsed to **0.72**, the lowest recorded on Earth.
- **Japan**: Has experienced population contraction for over a decade.
- **Europe**: Average birth rates sit below **1.5**, with sovereign pension systems under severe strain.
- **China**: The working-age population is shrinking by millions of workers each year.
The birth-rate drop is not an American quirk. It is worldwide.
When the entire developed world enters retirement at the exact same moment, there is no foreign cavalry waiting to buy American index funds and suburban homes at peak valuations.
---
### Why the Meltdown Won't Look Like a Crash
If you follow pure textbook math, asset prices should drop 40% to 60%.
When supply exceeds demand, prices fall. That is first-grade economics.
So why isn't the Glass Seagull predicting a 1929 stock market crash?
Because you must understand the **debt anchor**.
The United States government owes over **$40 Trillion**. The government relies on capital gains taxes from the stock market and property taxes from expensive real estate to pay the $1.1 Trillion in interest on that debt.
If the stock market falls 50%, tax collections collapse. When tax collections collapse, the government cannot pay its interest.
The government and the Federal Reserve have only one choice:
**They must print the difference.**
---
### Real Loss vs. Nominal Illusion
This is the central secret of the Seagull's thesis:
> **The asset meltdown will happen to your purchasing power, not your account balance.**
Your account balance on your phone might still say $100,000. It might even say $150,000.
You will feel rich because the number went up.
When you walk into the grocery store, a bag of groceries will cost $250. When you pay for car insurance, it will cost three times what it used to.
The assets will not crash in nominal paper dollars. Instead, the paper dollars will melt down around the assets.
If you hold cash or paper promises, you get drowned in the harbor. If you own tangible hard assets (scarce businesses, gold, and real property with low debt), you keep your seat on the lifeboat.
To see how different asset classes perform under currency dilution, test the [Lifeboat Matrix Telemetry](/signals/lifeboat-matrix).
---
### The Seagull's Flight Plan
1. **Do not trust paper cash for the long haul**: Cash guarantees you participate in the debasement without owning any productive engine.
2. **Watch demographics, not quarterly earnings**: A company selling products to an aging population without young replacements has a built-in ceiling.
3. **Seek scarce assets**: When paper dollars multiply faster than humans, things that cannot be printed become the only real store of value.
---
### Works Cited
Board of Governors of the Federal Reserve System. "Distribution of Financial Accounts: Wealth by Generation." _Federal Reserve Statistical Release_, 2026, https://www.federalreserve.gov/releases/z1/dataviz/dfa/.
Mankiw, N. Gregory, and David N. Weil. "The Baby Boom, the Baby Bust, and the Housing Market." _Regional Science and Urban Economics_, vol. 19, no. 2, 1989, pp. 235–258.
United States Census Bureau. "National Population Projections: Demographic Inversion and Total Fertility." _U.S. Department of Commerce_, 2026, https://www.census.gov/data/tables/time-series/demo/popest/2020s-national-total.html.
---
### The Consumer Mirage: Why the Economy Looks Rich While Real Families Break
*Canonical URL: https://glassseagull.com/blog/the-consumer-mirage*
*Date: OCT 17, 2026 | Category: Consumer Macro*
### Key Takeaways & Executive Summary
- **Q: What is the "Consumer Mirage"?**
- **A: It is the split between national headlines and kitchen tables. Headline GDP grows and unemployment looks low because the richest 20% of households earn 5% on cash and spend freely. Meanwhile, the bottom 60% burned through their savings and now borrows at 21% interest just to buy groceries.**
- **Q: Why does a $6,500 credit card balance trap a household today?**
- **A: Credit card interest rates jumped from 14.5% to over 21.5%. Paying the minimum bill on an average balance takes 18 years and burns over $10,400 in pure interest fees.**
---
Turn on financial television, and news anchors celebrate a booming economy.
Gross Domestic Product (GDP) marches higher. Unemployment stays near historical lows. Retail cash registers ring up record sales.
Walk down Main Street, and families tell a different story.
Parents juggle grocery bills. Young workers take second jobs. Credit card balances climb every month.
How can both stories happen at the exact same time?
The Seagull does not listen to political speeches. The Seagull tracks the balance sheets. What looks like a healthy economy from ten thousand feet is actually a statistical trick called the Consumer Mirage.
Here is how the numbers work, and where the cracks are spreading.
## 1. The Two-Speed Economy
The modern economy split into two tracks. Economists call this a K-shaped economy:
1. **The Top Arm of the K (The Top 20%):** These families own their homes with cheap 3% mortgages. They hold stocks and real estate. Best of all, they park cash in money market funds and earn 5% risk-free interest. They feel wealthy, and they spend freely. Their spending single-handedly lifts national GDP.
2. **The Bottom Arm of the K (The Bottom 60%):** These families rent or carry heavy debt. Inflation pushed their food, power, and car insurance bills up by 25% or more. They burned through their pandemic savings accounts. Now they swipe plastic cards to bridge the gap.
Look at the collapse in the U.S. Personal Saving Rate (FRED series `PSAVERT`):
| Macroeconomic Indicator | 2019 Baseline | 2026 Current Reading | What Changed |
| :----------------------------- | :------------- | :------------------- | :---------------------------------------------------------------- |
| **Personal Saving Rate** | 7.2% | **4.1%** | Households drained their cash cushions to pay higher living costs |
| **Total Consumer Debt** | $4.19 Trillion | **$5.19 Trillion** | Debt grew by $1 Trillion (+23.8%) as prices climbed |
| **Average Credit Card APR** | 14.50% | **21.59%** | The borrowing penalty jumped to record highs |
| **Average Card Balance** | $5,300 | **$6,501** | Balances jumped by 22.6% |
| **90+ Day Default Transition** | 5.0% | **7.10%** | Serious defaults jumped by 42% |
Families did not buy more items. They bought the same gallon of milk and tank of gas at inflated prices, and they paid with borrowed money.
## 2. The 21% Interest Treadmill
Carrying credit card debt has always cost money. Today, it operates like a financial vacuum cleaner.
When the Federal Reserve raised interest rates, credit card companies adjusted their terms overnight. The average commercial bank credit card rate (FRED series `TERMCBCCALLNS`) jumped from 14.5% to over 21.5%.
Look at what happens to a family carrying the average balance of $6,500:
- **Under 2019 Rates (14.5% [APR](/glossary#apr)):** Paying the minimum monthly payment clears the loan in 17 years. The family pays $6,662 in interest fees ($13,162 total payout).
- **Under 2026 Rates (21.5% [APR](/glossary#apr)):** Paying the minimum monthly payment takes **18.6 years**. The family pays **$10,423 in pure interest** ($16,923 total payout).
Even if that family tries to pay down their debt with a fixed $150 cash payment every month:
- At 14.5%, they pay off the balance in 62 months and pay $2,760 in interest.
- At 21.5%, that same $150 payment takes 88 months and burns $6,562 in interest.
That extra $3,800 is not spent on clothes, school supplies, or local restaurants. It funnels straight into bank profits. It acts like an invisible private tax on working families.
## 3. The Denominator Trick
If millions of families struggle, why do headline bank delinquency numbers look low?
In the official reports, the national credit card delinquency rate (FRED series `DRCCLACBS`) sits at 2.85%. Many commentators point to this number and say, "Everything is fine. During 2008, defaults hit 6.7%!"
That comparison hides a statistical trick called denominator dilution.
The headline delinquency rate divides unpaid balances by total credit lines. Over the last five years, wealthy Americans signed up for premium cards to collect airline points. They spend $10,000 every month and pay the bill in full.
That giant volume of spending makes the bottom of the fraction huge. It makes the delinquency percentage look small, even while real families fail to pay.
To find the truth, look at the transition rate tracked by the Federal Reserve Bank of New York:
- The rate of card balances moving into 90-day serious delinquency jumped to **7.10%**.
- In working-class zip codes, credit card defaults reached **20.1%**, matching the worst months of the 2008 financial crash.
- For small regional banks that lend to working families (FRED series `DRCCLOBS`), credit card defaults leaped to **6.49%**, while mega-banks that serve wealthy accounts (FRED series `DRCCLT100S`) sit at just 2.74%.
The banking system knows this. Under new accounting rules called CECL, regional banks must hold extra cash reserves against bad loans. To protect themselves, banks cut credit card limits and reject loan applications.
The umbrella gets snatched away right when the rain begins to pour.
## 4. The Hidden Student Loan Grace Period
Another big reason headline debt looks calm is government paperwork.
When federal student loan payments resumed, the Department of Education created a special 12-month program called "Fresh Start." During this grace period, missed student loan payments did not count against consumer credit scores.
Furthermore, officials moved 2.6 million defaulted loans out of regular loan systems and into a back-office resolution group.
This bureaucratic move wiped millions of delinquent borrowers off the official scoreboard. The debt did not disappear. It was simply swept behind a curtain. As those protections expire, those overdue bills will slam into household credit files.
## The Seagull's Take
The Consumer Mirage cannot last forever.
An economy cannot thrive when top-line growth depends on the top 20% spending money-market dividends, while the bottom 60% drowns in 21% revolving debt.
When credit limits max out, spending stops. When spending stops, business revenues drop. That is when lagging indicators like unemployment finally catch up with leading indicators like credit defaults.
The Seagull watches the ground, not the clouds. If you want to survive the squeeze, pay off high-interest unsecured debt immediately. Build an emergency cash buffer, reject easy consumer credit, and invest in real, productive [hard assets](/glossary#hard-asset) that no algorithm can inflate away.
### Works Cited
Board of Governors of the Federal Reserve System. "Commercial Bank Interest Rate on Credit Card Plans, All Accounts [TERMCBCCALLNS]." _FRED, Federal Reserve Bank of St. Louis_, 9 Oct. 2026, [https://fred.stlouisfed.org/series/TERMCBCCALLNS](https://fred.stlouisfed.org/series/TERMCBCCALLNS).
Board of Governors of the Federal Reserve System. "Delinquency Rate on Credit Card Loans, All Commercial Banks [DRCCLACBS]." _FRED, Federal Reserve Bank of St. Louis_, 14 Oct. 2026, [https://fred.stlouisfed.org/series/DRCCLACBS](https://fred.stlouisfed.org/series/DRCCLACBS).
Board of Governors of the Federal Reserve System. "Delinquency Rate on Credit Card Loans, Banks Not Among the 100 Largest in Size by Assets [DRCCLOBS]." _FRED, Federal Reserve Bank of St. Louis_, 14 Oct. 2026, [https://fred.stlouisfed.org/series/DRCCLOBS](https://fred.stlouisfed.org/series/DRCCLOBS).
Board of Governors of the Federal Reserve System. "Delinquency Rate on Credit Card Loans, Banks Ranked 1st to 100th Largest in Size by Assets [DRCCLT100S]." _FRED, Federal Reserve Bank of St. Louis_, 14 Oct. 2026, [https://fred.stlouisfed.org/series/DRCCLT100S](https://fred.stlouisfed.org/series/DRCCLT100S).
Board of Governors of the Federal Reserve System. "Total Consumer Credit Owned and Securitized [TOTALSL]." _FRED, Federal Reserve Bank of St. Louis_, 7 Oct. 2026, [https://fred.stlouisfed.org/series/TOTALSL](https://fred.stlouisfed.org/series/TOTALSL).
Federal Deposit Insurance Corporation. "Quarterly Banking Profile: Second Quarter 2026." _FDIC_, 2026, [https://www.fdic.gov/analysis/quarterly-banking-profile](https://www.fdic.gov/analysis/quarterly-banking-profile).
Federal Reserve Bank of New York. _Quarterly Report on Household Debt and Credit_. Center for Microeconomic Data, May 2026, [https://www.newyorkfed.org/microeconomics/hhdc](https://www.newyorkfed.org/microeconomics/hhdc).
U.S. Bureau of Economic Analysis. "Personal Saving Rate [PSAVERT]." _FRED, Federal Reserve Bank of St. Louis_, 1 Oct. 2026, [https://fred.stlouisfed.org/series/PSAVERT](https://fred.stlouisfed.org/series/PSAVERT).
U.S. Bureau of Economic Analysis. "Real Disposable Personal Income [DSPIC96]." _FRED, Federal Reserve Bank of St. Louis_, 1 Oct. 2026, [https://fred.stlouisfed.org/series/DSPIC96](https://fred.stlouisfed.org/series/DSPIC96).
---
### The Economic Fractalist: Mandelbrot Market Cycles & Crash Warning | Glass Seagull
*Canonical URL: https://glassseagull.com/blog/the-economic-fractalist*
*Date: OCT 09, 2026 | Category: Market Cycles*
### Executive Briefing (AI Context & Direct Answer)
- **Q: What is an Economic Fractalist?**
- **A: An Economic Fractalist is a macroeconomic analyst or trader who models financial markets using fractal geometry rather than classical Gaussian bell curves. Developed from the mathematical discoveries of Benoit Mandelbrot, economic fractals demonstrate that price charts look self-similar across all timeframes (days, months, decades) and that catastrophic crashes and wild booms occur exponentially more frequently than traditional financial risk models predict due to power-law fat tails.**
- **Q: Why does fractal economics matter in 2026?**
- **A: Modern financial institutions still base risk metrics like Value at Risk (VaR) on bell curves that treat events like 1987, 2008, 2020, and 2026 liquidity squeezes as impossible statistical outliers. Economic fractals prove that extreme volatility is a built-in feature of market structures, allowing sovereign investors to prepare for rapid systemic liquidations rather than being blindsided by them.**
---
Most bank managers and college textbooks tell you a simple story about money.
They say stock prices move like coin flips.
If you flip a coin one thousand times, you get about half heads and half tails. Most days are calm. Big spikes and giant crashes are supposed to be as rare as a lightning bolt hitting the exact same tree six times in a row.
They draw a smooth hill and call it the **"Bell Curve"**.
```
Classical Bell Curve (What Wall Street Promises)
.-.
/ \
/ \
.-' '-.
----------------------' '----------------------
Crash Risk: "Supposedly 0.0001% chance (once every 10,000 years)"
```
There is only one problem: **The real world does not work like a bell curve.**
Crashes do not happen once every ten thousand years. They happen every seven to ten years.
In the 1960s, a mathematician named **Benoit Mandelbrot** looked at cotton prices stretching across one hundred years. He discovered something that shocked economists.
Markets do not move like gentle coin flips. They move in **fractals**.
---
### What Is a Fractal? (The Romanesco Broccoli Lesson)
A **fractal** is a shape that repeats itself no matter how close or far away you stand.
Think of a piece of **Romanesco broccoli** or a **fern leaf**:
```
Big Branch Medium Branch Tiny Leaf
\ | / \ | / \ | /
-- * -- -- * -- -- * --
/ | \ / | \ / | \
(Looks the same) (Looks the same) (Looks the same)
```
- If you look at the whole giant head of broccoli, you see pointy spirals.
- If you snap off a single bite-sized branch, it looks like a mini version of the giant head.
- If you zoom in with a microscope on one leaf tip, it _still_ looks identical.
Scientists call this **"self-similarity"**.
Mandelbrot took charts of stock prices and printed them out with the labels covered up.
He asked seasoned floor traders: _"Which chart is one day of trading, which is one month, and which is ten years?"_
The traders could not tell the difference.
A 10-minute flash crash has the exact same jagged shape, turbulence, and mathematical rhythm as a multi-year economic depression.
---
### The Two Types of Wildness
Mandelbrot divided the world into two different neighborhoods:
| Neighborhood | How It Behaves | Real-Life Example |
| :---------------------------------------- | :----------------------------------------------------------- | :-------------------------------------------------------------------------------------------------------------- |
| **Mild Wildness** (Bell Curve) | Changes are small. A single giant cannot change the average. | Heights of people in a town. Even if the tallest person walks in, the average barely moves. |
| **Wild Wildness** (Fractals & Power Laws) | One single event dominates everything that came before it. | Wealth in a town. If Elon Musk walks into a coffee shop, the average net worth instantly jumps to $500 Million. |
Wall Street prices live in **Wild Wildness**.
In classical finance, a 10% market crash in a single day is calculated as a "22-sigma event." That means it should happen once every 100,000,000,000 years (longer than the age of the universe).
Yet the United States experienced that in October 1987, and again in March 2020.
```
Fractal Power Law (What Actually Happens)
|
/ \
/ \
/ \
---------' '---------
FAT TAIL FAT TAIL
(Violent Booms) (Sudden Crashes)
```
Because of **"fat tails"**, extreme market swings do not crawl along a bell curve. They strike with power-law force.
---
### Memory in the Water: Why Price Shocks Linger
Classical finance also assumes each day starts fresh with zero memory of yesterday.
Mandelbrot showed that markets have **long memory**.
When a ship sails through quiet water, the waves stay calm. But when a gale whips up fifty-foot waves, the water does not instantly freeze into glass the second the wind stops blowing.
The swell continues for days.
In financial markets:
1. **Volatility clusters**: Big price jumps are almost always followed by more big jumps.
2. **Quiet clusters**: Calm periods breed false confidence, causing people to borrow too much money.
3. **The snap**: When the calm breaks, the turbulence feeds on itself recursively.
---
### How to Build a Portfolio for a Fractal World
Once you understand that markets are fractals, your entire strategy changes.
You stop trusting smooth predictions from financial advisors who promise "safe 8% annual returns."
Instead, you prepare for the jagged edges of reality:
1. **Avoid Hidden Leverage**: Debt turns a temporary fractal dip into a permanent liquidation. If you do not owe debt on your assets, a violent swing cannot force you to sell.
2. **Hold Non-Correlated Anchors**: Paper assets move together during liquidity panics. Real assets (such as physical gold, productive soil, and essential tools) anchor your balance sheet when paper systems break.
3. **Expect the "Impossible"**: Never risk wealth on the bet that an extreme crash cannot happen. In fractal geometry, extreme moves are not anomalies; they are guaranteed structural events.
---
### Works Cited
Mandelbrot, Benoit B., and Richard L. Hudson. _The (Mis)Behavior of Markets: A Fractal View of Risk, Ruin, and Reward_. Basic Books, 2004.
Mandelbrot, Benoit B. "Fractals and Scaling in Finance: Discontinuity, Concentration, Risk." _Springer Science & Business Media_, 1997.
Taleb, Nassim Nicholas. _The Black Swan: The Impact of the Highly Improbable_. Random House, 2007.
Federal Reserve Bank of St. Louis. "CBOE Volatility Index: VIX." _FRED, Federal Reserve Bank of St. Louis_, 2026, https://fred.stlouisfed.org/series/VIXCLS.
---
### The Economics of 'Growing Up': Why the Soil is No Longer Fertile
*Canonical URL: https://glassseagull.com/blog/the-economics-of-growing-up*
*Date: AUG 02, 2026 | Category: Macro Economics*
Why are younger generations delaying traditional milestones of adulthood? The answer lies in the data: the purchasing power required to achieve them has collapsed due to asset inflation drastically outpacing real wage growth.
In the telemetry of economics, we generally avoid subjective words like "maturity." Instead, we track a highly measurable phenomenon: **household formation** and the timing of **life-cycle milestones**.
Maturity requires the "fertile soil" of purchasing power. When that soil erodes, the timeline for "growing up" fundamentally breaks. Here is how the Seagull looks at this macroeconomic shift.
### 1. The Economics of "Growing Up"
Maturity isn't just a biological clock ticking away in the background; it is a behavioral adaptation to economic incentives. In past cycles, graduating high school or college came with a massive, immediate leap in **purchasing power**.
That purchasing power unlocked actionable economic events: buying a car, signing a lease, getting married, or securing a mortgage. Each of these actions acts as a strict forcing function. When you sign a mortgage or have a child, you are forced by the system to budget, delay immediate gratification, maintain physical assets, and plan decades into the future.
Society looks at those resulting behaviors and calls them "maturity." But from a cold, analytical standpoint, they are simply the required management skills for having skin in the game.
### 2. The Purchasing Power Shift
To understand why the soil is no longer fertile, we have to look past the noisy nominal numbers and focus on the signal: **Real Wages**. This metric measures how much actual _stuff_ your paycheck can buy, rather than the fiat digits printed on it.
Let's look at the ultimate forcing function of maturity: acquiring a starter home.
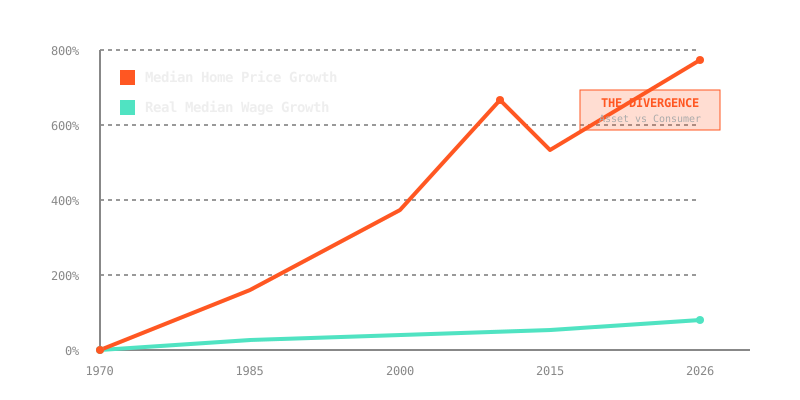
| Era | The Economic Setup | The Behavioral Result |
| ----------------- | ------------------------------------------------------------------------------------ | ------------------------------------------------------------------------------------------------------------------------------------------------------ |
| **The 1970s/80s** | A home cost roughly **3 to 4 times** a single average salary. | A young adult could save a down payment in their early 20s. The home was acquired early, and the responsibilities of the home _forced_ them to mature. |
| **Today** | A home often costs **7 to 10 times** the average salary (and requires dual incomes). | The math breaks down entirely. The timeline to save a down payment stretches far into a person's 30s. |
### 3. Signal vs. Noise: Asset vs. Consumer Inflation
The core distortion for young adults today is the violent divergence between two types of inflation:
- **Consumer Inflation (The Noise):** The price of everyday depreciating goods like groceries, flat-screen TVs, and fast fashion. Wages have mostly tried to keep pace with these items over the long run to keep the population placated.
- **Asset Inflation (The Signal):** The price of things that actually build independence, stability, and wealth: housing, land, and higher education. The cost of these assets has skyrocketed, becoming a massive albatross around the neck of the middle class, completely out of proportion to entry-level wages.
Young adults today can afford a high-definition TV and a smartphone faster than their parents could, but they are entirely priced out of the assets that historically triggered the shift into adulthood.
### 4. The Rational Response
When we track human behavior in our models, we assume people act rationally based on the incentives presented to them. If the cost of the traditional "maturity milestones" becomes mathematically out of reach, young adults will logically delay them.
Run the scenario: You are 24. You realize that even if you save 20% of your income, you still won't be able to buy a starter home until you are 35. The immediate pressure to "hunker down and grow up" evaporates. You find yourself trapped in an extended adolescence. Instead of saving for a house that is accelerating away from you faster than your yield, you rationally spend your disposable income on immediate experiences, travel, or lifestyle comforts.
Older generations often view this as "immature." An economist views it as a completely rational reallocation of capital by a demographic that has been priced out of the primary market.
Maturity isn't spontaneously generated by turning 22. It is forged by managing economic responsibility. When the macroeconomic environment removes the ability to acquire those responsibilities, the timeline for "growing up" naturally stretches out. We are navigating a broken system. Watch the telemetry, ignore the noise, and adapt.
---
### The Physics of Fiat: Why the National Debt Warps Your Reality
*Canonical URL: https://glassseagull.com/blog/the-physics-of-fiat*
*Date: JAN 01, 2024 | Category: Core Concepts*
### Key Takeaways & Executive Summary
- **Q: What is the difference between the national deficit and the national debt?**
- **A: The deficit is the annual shortfall (speed/velocity), while the debt is the total accumulated shortfall over time (mass).**
- **Q: Why does the debt-to-GDP ratio matter?**
- **A: It measures the leverage of the economic machine. Once it crosses extreme thresholds (e.g., 100%+), the sheer gravity of the debt forces the central bank to suppress interest rates and inflate the currency to avoid nominal default.**
---
If you listen to the talking heads on financial television, the National Debt is treated as a political football. One side screams that it will destroy the country tomorrow; the other side claims it doesn't matter at all because "we owe it to ourselves."
The Seagull ignores the squawking. We only care about the telemetry.
To understand the debt, you have to stop thinking about it as a political issue and start thinking about it as _physics_. In astrophysics, mass creates gravity. When a star gets massive enough, its gravitational pull becomes so strong that it bends light and warps the fabric of spacetime around it.
In macroeconomics, debt is mass. When a sovereign nation accumulates enough of it, the sheer gravity of that debt warps the economic universe: bending interest rates, distorting asset prices, and slowly crushing the purchasing power of your labor.
Welcome to the Physics of Fiat. This is your operator's manual.
## 1. The Velocity vs. The Mass (Deficit vs. Debt)
The first step to reading the telemetry is understanding the difference between two terms that politicians intentionally conflate: the _Deficit_ and the _Debt_.
- **The Deficit (Velocity):** The deficit is simply the difference between what the government spends and what it collects in taxes _in a single year_. If the government collects $4 Trillion in taxes but spends $6 Trillion, it has run a $2 Trillion deficit. This is the speed at which we are adding mass.
- **The Debt (Mass):** The national debt is the total accumulation of every single deficit run throughout the nation's history. It is the aggregate mass sitting on the balance sheet.
When a politician proudly announces that they have "cut the deficit by half," they have not reduced the debt. They have simply reduced the _speed_ at which the debt is growing. The mass is still increasing, just slightly slower.
## 2. The Debt-to-GDP Ratio: Measuring the Machine
Looking at the raw debt number (e.g., $34 Trillion) is useless without context. If you have $100,000 in personal debt, that sounds terrifying if your salary is $30,000. It sounds entirely manageable if your salary is $500,000.
The **Debt-to-GDP ratio** provides that context for a sovereign nation. It compares the total national debt to the Gross Domestic Product (the total economic output of the country in a year). It is the ultimate measure of leverage.
Historically, the United States maintained a relatively low debt-to-GDP ratio, spiking only during existential crises like the Civil War or World War II. After those crises, the economic machine would grow, and the debt was paid down. But in the modern fiat era (especially after 2008), debt has become a permanent structural tool used to manufacture growth.
When your Debt-to-GDP ratio crosses 100%, you are carrying a mortgage larger than your annual economic output. It is the ultimate canary in the coal mine for a fiat currency.
## 3. Warping the Macro Universe
This is where the physics come into play. When the debt mass crosses critical thresholds (like 100% or 120% of GDP), the gravity of the debt becomes the dominant force in the economy.
The government must pay interest on its debt. When the debt is small, interest payments are a minor line item. When the debt is massive, interest payments threaten to consume the entire budget.
If interest rates rise to natural market levels (say, 5% or 6%), the interest expense on $34 Trillion becomes unpayable. Therefore, the central bank _must_ intervene. They are forced to suppress interest rates artificially, printing money to buy government bonds and keeping the yields low.
The gravity of the debt has forced the central bank's hand. They can no longer raise rates to fight inflation or cool the economy, because doing so would bankrupt the Treasury.
## 4. The Event Horizon: Why It Matters to You
Why does the Seagull care? Because you cannot escape macro-gravity.
If the government cannot raise interest rates, and it cannot default on its nominal obligations, there is only one mathematical release valve: **[Inflation](/glossary#real-inflation)**.
To manage the massive debt burden, the government must continually expand the money supply, debasing the currency. They pay back their old, expensive debt with newly printed, cheaper dollars.
This is a hidden, silent tax on the population. Your wages stay the same, but your purchasing power evaporates. The prices of scarce assets (real estate, equities, commodities, and Bitcoin) skyrocket, not because they are inherently more valuable, but because the [fiat currency](/glossary#fiat-currency) they are priced in is collapsing under the gravitational weight of the national debt.
The Seagull doesn't panic. The Seagull simply reads the telemetry. When the debt gets this massive, you don't hold paper cash. You hold [hard assets](/glossary#hard-asset) that can withstand the gravity. Historically, when international trade was settled in real specie, [David Hume's Price-Specie-Flow Mechanism](/blog/the-price-specie-flow-mechanism) automatically prevented nations from running infinite debt. Today, in an unbacked paper world, you have to protect your own balance sheet before inflation eats your fries. You ride the thermals and leave the rest of the flock wondering why their savings buy less every year.
---
### Works Cited
Federal Reserve Economic Data (FRED). "Federal Debt: Total Public Debt as Percent of Gross Domestic Product." _St. Louis Fed_, 2024.
Reinhart, Carmen M., and Kenneth S. Rogoff. "Growth in a Time of Debt." _American Economic Review_, vol. 100, no. 2, May 2010, pp. 573-78.
---
### David Hume's Price-Specie-Flow Mechanism: Why Paper Money Always Fails
*Canonical URL: https://glassseagull.com/blog/the-price-specie-flow-mechanism*
*Date: OCT 08, 2026 | Category: Monetary History*
---
### What Is Specie Currency and What Are Specie Payments?
Before paper debt ruled international trade, commerce required tangible settlement:
- **Specie Currency**: Coined physical metal (gold or silver) carrying intrinsic value. Unlike paper notes, specie currency cannot be inflated or printed out of thin air.
- **Specie Payments**: The redemption of paper banknotes or financial obligations directly into physical gold or silver coin upon demand. When a central bank suspends specie payments, it freezes gold redemptions and forces citizens onto pure unbacked paper.
A long time ago, people did not use paper dollars or computer cards to buy things from other countries.
They used shiny metal coins made of gold and silver. Economists call that metal money **"specie"**.
In 1752, a wise thinker named **David Hume** figured out a rule about how money travels between nations. He called it the **Price-Specie-Flow Mechanism**. Here is how it works, and why it is the most important lesson for anyone trying to save their wealth in 2026.
---
### The Two Islands: How Real Money Balances Itself
Imagine two islands: **Island Alpha** and **Island Beta**.
Island Alpha makes great shoes. Island Beta grows delicious apples.
Both islands use gold coins to trade:
```
[ Island Alpha: Shoes ] <======= GOLD COINS ======= [ Island Beta: Apples ]
[ Island Alpha: Shoes ] ====== SHINY SHOES ======> [ Island Beta: Apples ]
```
1. People on Island Beta love the shoes so much that they buy thousands of pairs.
2. To pay for the shoes, Island Beta must load ships with **gold coins** and sail them over to Island Alpha.
3. Now, Island Alpha has a giant mountain of gold coins. Island Beta has almost no gold left.
Now, what happens to the prices on both islands?
- **On Island Alpha**: Gold is everywhere. Because money is easy to find, shopkeepers raise their prices. Shoes now cost 5 gold coins instead of 1.
- **On Island Beta**: Gold is scarce. Nobody has coins to spend. To sell anything, shopkeepers must slash their prices. Apples now cost just a tiny sliver of a coin.
Suddenly, the shoes on Island Alpha are way too expensive. And the apples on Island Beta are dirt cheap!
So the trade flips:
People on Island Alpha start buying cheap apples from Island Beta. The gold coins sail right back across the ocean.
**The system balances itself automatically.**
No government committee had to tell anyone what to do. The physical gold kept both islands honest.
---
### The Day the Gold Ships Stopped (1971)
For hundreds of years, this rule kept empires from printing infinite money.
If a king spent too much gold buying fancy things from abroad, his gold flowed out, his country ran out of money, and his people stopped buying until the budget balanced.
In August 1971, that rule was shut off.
President Richard Nixon announced that the United States would no longer trade paper dollars for real gold.
From that day forward, when America wanted to buy cars from Japan, oil from Saudi Arabia, or electronics from Germany, it did not have to ship crates of gold coins.
It just printed green paper tickets, or typed numbers on a computer screen.
```
1752 Gold Standard: Imports require sending real gold. (Natural limit)
1971 Fiat Standard: Imports require printing paper tickets. (No limit)
```
For 50 years, this felt like magic. America could buy all the physical goods in the world, and send back pieces of paper.
---
### The 2026 Breaking Point: The Return of Specie
What happens when you print paper tickets for 50 years?
You get **$40 Trillion in national debt**.
You get a government that pays over **$1.1 Trillion every year** just in interest to hold the debt together.
Foreign nations are looking at the giant pile of paper tickets and realizing something dangerous:
_The paper tickets cannot be turned into anything real._
That is why central banks around the world have quietly changed their behavior over the last three years:
- In 2024, 2025, and 2026, global central banks bought more physical gold than at any point since the 1960s.
- Countries are settling trade in their own currencies or demanding physical commodities (oil, copper, and bullion) instead of holding long-term U.S. Treasury paper.
David Hume was right 274 years ago:
> **You can fool human laws for a generation, but you cannot fool the laws of arithmetic.**
Paper promises can be multiplied by typing on a keyboard. Real specie (gold, productive farms, energy, and real machinery) cannot be created out of thin air.
When paper money loses trust, trade always returns to specie.
---
### How to Protect Your Nest
The Seagull does not trade short-term squawks. We look at the centuries.
1. **Understand what money is**: Fiat currency is a temporary token used for transactions. It is not a permanent savings vessel.
2. **Anchor in tangible value**: When sovereign nations begin hoarding real specie, individual investors should pay attention. Real gold, productive equities, and scarce resources hold their ground when paper promises wash away with the tide.
3. **Study the history**: The algorithms on Wall Street only look at the last five years of data. The Seagull looks at 1752, 1932, and 1971.
---
### Works Cited
Hume, David. "Of the Balance of Trade." _Essays, Moral, Political, and Literary_, edited by Eugene F. Miller, Liberty Fund, 1987, pp. 308–326. Originally published in 1752.
World Gold Council. "Central Bank Gold Reserves Survey 2026." _World Gold Council Research_, June 2026, https://www.gold.org/goldhub/data/gold-reserves-by-country.
Bank for International Settlements. "Foreign Exchange and Over-the-Counter Derivatives Markets in 2026." _BIS Triennial Central Bank Survey_, 2026, https://www.bis.org/statistics/derstats.htm.
---
### The Retail Allocation Trap: How Brokerages Ration IPOs
*Canonical URL: https://glassseagull.com/blog/the-retail-allocation-trap*
*Date: SEP 26, 2026 | Category: Market Mechanics*
### Key Takeaways & Executive Summary
- **Q: Do retail investors get fair access to hot IPOs on apps like Robinhood or Fidelity?**
- **A: No. Institutional funds capture roughly 90% of primary shares. In hot, oversubscribed offerings, retail brokers receive a tiny pool (often under 10%), rationing individual orders down to single-digit fill rates.**
- **Q: What is the penalty for "flipping" an IPO allocation as a retail trader?**
- **A: If a retail investor sells allocated IPO shares within the first 30 days of trading to lock in a first-day pop, brokerages flag their account and ban them from participating in new IPO offerings for 60 to 180 days.**
---
For years, Wall Street kept Initial Public Offerings behind locked boardroom doors.
Only giant hedge funds and wealthy private banking clients were allowed to buy shares at the initial offer price. Everyone else had to wait until the stock opened on the stock exchange, usually after the price had already spiked 20% to 50% in the morning rush.
Then modern retail brokerages showed up. They promised to change everything. They gave everyday people a button on their phone to request IPO shares directly.
It sounded like a revolution. But if you look at the raw numbers, the game did not change. Wall Street just built a new room for the crowd.
Here is how the retail IPO allocation machine actually works, why you get tiny scraps when a company is hot, and why you get flooded with shares only when the deal is a dud.
```mermaid
flowchart TD
subgraph Underwriters ["Investment Banks (Underwriters)"]
Deal["Total IPO Share Supply 100% of New Capital"]
end
subgraph Allocation ["Primary Allocation Split"]
Inst["Institutional Whales (90%) Mutual Funds, Hedge Funds, Pensions"]
RetailPool["Retail Brokerage Pool (10%) Robinhood, Fidelity, SoFi"]
end
subgraph RetailOutcome ["Retail Distribution"]
Hot["Hot Oversubscribed IPO Order Diluted: 4% to 12% Fill"]
Cold["Cold Broken IPO 100% Filled (Lemons Problem)"]
end
Deal --> Inst
Deal --> RetailPool
RetailPool --> Hot
RetailPool --> Cold
```
## 1. The 90/10 Rule: How the Pie is Sliced
When an investment bank takes a company public, their main job is finding big buyers who will hold millions of dollars worth of stock.
These buyers are called institutional investors. They are retirement funds, university endowments, and massive money managers like BlackRock and Fidelity.
Because these big funds write checks for $50 million or $100 million at a time, the banks give them **about 90% of all the shares** in the offering (SEC Office of Investor Education).
The remaining **10%** is handed over to retail brokerages to distribute among hundreds of thousands of individual app users.
Even when a company tries to give retail more, the math bites back. In the massive 2026 SpaceX public offering ($75 billion raised under SEC Form 424B4), the company opened an unprecedented 30% of the deal to everyday buyers. But because bankers only floated 4.1% of all shares to the public, millions of app users fought over crumbs. The stock shot up to $225.64 on pure hype, then cratered 32% back down to $153.47 as late retail buyers held the bag.
When a hot deal is oversubscribed, demand runs five times greater than supply. Your broker does not get extra shares. They ration their slice across thousands of hopeful accounts.
Use the interactive calculator below to see what happens to a normal order when institutional interest surges:
If you asked to buy $2,500 worth of shares in a hot IPO, you might expect to get 50 shares. Instead, the algorithm assigns you just 2 or 3 shares ($100 to $150).
If the stock pops 30% on its first day, your total profit is less than forty dollars. You took the risk of researching the company, tied up your cash for days, and made enough to buy two burritos.
## 2. The 30-Day Flipping Trap
Suppose you get lucky. You get assigned shares, and on day one, the stock jumps up 25%.
Naturally, you might want to click "Sell" and lock in your profit before the market changes its mind.
**If you do, your broker penalizes you.**
Brokerages have a strict rule against [IPO flipping](/dictionary#ipo-flipping). If you sell your allocated shares within **30 calendar days** of the debut, the brokerage flags your account:
| Brokerage Platform | Flipping Penalty Window | Penalty for Selling Early |
| :----------------- | :---------------------- | :------------------------------------------------------ |
| **Robinhood** | First 30 Days | **60-Day Ban** from all upcoming IPO offerings |
| **Fidelity** | First 30 Days | **180-Day Ban** from participation in primary pools |
| **SoFi Invest** | First 30 Days | **$50 Fee + 180-Day Ban** on subsequent IPO allocations |
Why do brokerages enforce this rule? Because the investment banks penalize the brokerage if retail buyers dump shares on day one. To keep their relationship with Wall Street banks, retail apps turn around and punish their own users.
This creates a dangerous bind for individual investors:
- If you sell early to pocket a fast gain, you get blacklisted from the next offering.
- If you obey the rule and hold for 30 to 90 days, you are forced to hold the stock right into the insider selling window.
## 3. The Lemons Problem: When You Get Everything You Asked For
Economist George Akerlof won a Nobel Prize for describing the "Market for Lemons." In any market where the seller knows more than the buyer, the buyer ends up with the bad items.
The exact same phenomenon governs IPO allocations:
1. **When the IPO is a home run:** Every hedge fund and billionaire wants in. The deal is heavily oversubscribed. Retail gets rationed down to tiny scraps (1% to 10% of their order).
2. **When the IPO is an overpriced dud:** Big institutional funds pass on the offering. There is plenty of supply to go around. Suddenly, your retail broker happily fills **100% of your order**.
If you wake up on listing morning and discover that your broker filled every single share you requested, **be careful.** It usually means the smartest money on Wall Street walked away from the table.
```mermaid
flowchart LR
A["Your IPO Order Placed"] --> B{"Was the Deal Oversubscribed?"}
B -->|"YES (High Demand)"| C["Tiny Allocation (4%-12%) Stock Pops, Minimal Dollar Gain"]
B -->|"NO (Institutional Pass)"| D["100% Full Allocation High Risk of Day-One Loss"]
```
## 4. The 180-Day Supply Shock
Even if a company survives its first 30 days without dropping, another major hurdle looms on the horizon: the [lock-up period](/dictionary#lock-up-period).
When a company goes public, company founders, early employees, and venture capital backers are legally barred from selling their shares for **90 to 180 days** (Securities and Exchange Commission Rule 144).
During those first six months, only a tiny fraction of the company's total shares are actually traded on the market (this is called the "float"). Because the supply is artificially small, the stock price can stay high.
```mermaid
flowchart TD
Day0["Day 0: Public Debut Float: 10% of total shares"] --> Day30["Day 30: Retail Flipping Restriction Ends"]
Day30 --> Day180["Day 180: Lock-Up Expiration Float Floods by +400% to +800%"]
Day180 --> MarketImpact["Insiders Liquidate Shares Abnormal Negative Price Pressure"]
```
When day 181 arrives, the dam breaks. Early venture funds who bought shares for pennies seven years ago are finally allowed to sell. Academic studies examining decades of US market data show that stock prices consistently experience abnormal negative returns surrounding lock-up expirations (Field and Hanka 471). Track upcoming cliff dates, insider float dilution multiples, and VC vintage pressure for recent listings on our live [Lock-Up Expiration Radar](/signals/ipo-2026#lock-up-radar).
The retail investor who held on to avoid a flipping penalty is left holding the bag right as millions of insider shares flood into the open market.
## The Seagull's Rules for IPOs
The Seagull does not chase the flock into a crowded bay just because someone threw bread into the water.
If you plan to navigate public offerings, keep these three rules pinned to your desk:
1. **Calculate the Real Dollar Return:** A 40% first-day jump on a $120 fill is only $48. Never tie up $5,000 in buying power for days just to chase spare change.
2. **Beware the 100% Fill:** If an app gives you every single share you asked for on a mega-cap tech offering, treat it with deep skepticism. The big fish already said no.
3. **Mark the 180-Day Calendar:** Never buy a newly public company without setting an alarm for its lock-up expiration date. If you love the business, wait until the early venture capitalists finish dumping their shares before building a long-term position.
This structural seller-versus-buyer imbalance is not limited to tech IPOs. Across the entire macroeconomic horizon, when a giant wave of retiring owners begins liquidating assets into an undersized pool of younger buyers, similar valuation pressures emerge. This forms the foundational premise of [the Asset Meltdown Hypothesis](/blog/the-asset-meltdown-hypothesis).
### Works Cited
Akerlof, George A. "The Market for 'Lemons': Quality Uncertainty and the Market Mechanism." _The Quarterly Journal of Economics_, vol. 84, no. 3, 1970, pp. 488–500.
Field, Laura Casares, and Gordon Hanka. "The Expiration of IPO Share Lockups." _The Journal of Finance_, vol. 56, no. 2, 2001, pp. 471–498.
Financial Industry Regulatory Authority (FINRA). _Rule 5130: Restrictions on the Purchase and Sale of Initial Equity Public Offerings_. FINRA Manual, 2024, [https://www.finra.org/rules-guidance/rulebooks/finra-rules/5130](https://www.finra.org/rules-guidance/rulebooks/finra-rules/5130).
Ritter, Jay R. "The Long-Run Performance of Initial Public Offerings." _The Journal of Finance_, vol. 46, no. 1, 1991, pp. 3–27.
U.S. Securities and Exchange Commission (SEC). "Investing in an IPO." _Investor Bulletin_, Office of Investor Education and Advocacy, [https://www.sec.gov/files/ipo-investorbulletin.pdf](https://www.sec.gov/files/ipo-investorbulletin.pdf).
U.S. Securities and Exchange Commission (SEC). _Rule 144: Persons Not Deemed to Be Engaged in a Distribution_. Electronic Code of Federal Regulations, 17 CFR § 230.144, 2024.
U.S. Securities and Exchange Commission (SEC). "Space Exploration Technologies Corp. Prospectus (Form 424B4)." _SEC EDGAR System_, Accession No. 0001628280-26-042639, 3 June 2026, [https://www.sec.gov/Archives/edgar/data/1181412/000162828026042639/spaceexplorationtechnologi.htm](https://www.sec.gov/Archives/edgar/data/1181412/000162828026042639/spaceexplorationtechnologi.htm).
---
### The Sovereign Hull Assessment: Is the U.S. Economy Sinking or Just Stratified?
*Canonical URL: https://glassseagull.com/blog/the-sovereign-hull-assessment*
*Date: SEP 27, 2026 | Category: Macro Telemetry*
### Key Takeaways & Executive Summary
- **Q: Is the U.S. economy currently a sinking ship?**
- **A: No, but it is a split two-tier fleet. While the government balance sheet faces extreme debt-servicing friction ($40T+ debt, $1.1T interest outlays) and the bottom 50% of households suffer credit exhaustion (3% savings rate), mega-cap corporate balance sheets, top-tier asset owners, and global dollar trade demand remain resilient.**
---
Imagine you are standing on the deck of a massive ocean ship.
Some people look at the water coming into the lower decks and scream: _"The ship is sinking!"_
Other people sitting in the sunny top-deck restaurant look at the strong engines and say: _"Nonsense! We are moving faster than ever!"_
Both of these people are looking at the exact same ship. But they are living in completely different realities.
That is exactly what is happening to the U.S. economy in 2026.
---
### The Big Hole in the Ship: $40 Trillion in Debt
Let's look at the numbers first.
In August 2026, the U.S. national debt crossed **$40 Trillion**.
To pay the interest on that debt, the government now pays **$1.1 Trillion every single year**. For the first time in history, paying interest costs more than the entire U.S. military defense budget.
U.S. FISCAL CROSSOVER: INTEREST EXPENSE VS DEFENSE (2026)HISTORIC CROSSOVER
Annual Net Interest Outlays:$1,102,000,000,000 (18.5% Tax Receipts)
National Defense Budget:$850,000,000,000
When interest payments get this big, something called **Fiscal Dominance** happens. That is a big term, but it means something simple: the government cannot afford higher interest rates without going broke. So the central bank has to keep printing money or buying government debt.
When money gets printed to cover debt, your cash buys less food, gas, and housing. That is silent money melting.
---
### Steerage vs. First Class: The Two-Tier Fleet
The ship isn't sinking for everyone. It is split into two rooms:
1. **Steerage (The Bottom 50%)**: These are everyday workers who earn wages and keep their money in normal bank accounts.
- Their personal savings rate dropped to just **3.0%**.
- Subprime auto loan defaults surged past **5.5% to 6.8%**, the highest level in over twenty years.
- Their wages cannot keep up with six years of compounding prices.
2. **First Class (The Top 10%)**: These are people and big companies that own real estate, stock market shares, and hard assets.
- The top 10% own over **70% of all national wealth**.
- Big tech companies locked in low interest rates back in 2020 and hold billions in cash earning high interest.
- When the government prints money to service debt, asset prices jump UP. First class gets richer while steerage pays the bill.
---
### Why the Engine Hasn't Stopped (The Bull Case)
If the debt is so high, why hasn't the ship stopped completely?
Because the U.S. dollar is still the main currency of world trade.
Over **57% of all global currency reserves** and **89% of world trade deals** use the U.S. dollar. Because the whole world needs dollars to buy oil and trade, the U.S. enjoys what economists call **Convenience Yield**. The world lets America borrow about 30% more debt than any other country before hitting a wall.
On top of that, American companies are investing hundreds of billions into artificial intelligence and computer hardware, driving high productivity gains.
---
### The Lifeboat Matrix: How to Protect Your Family
If the state has to keep printing money to pay its debt, holding pure cash or long-term bonds is like sitting on the lower deck with water up to your knees.
Here is how different assets perform in a world of debt-printing:
| Asset Class | Safety Against Debt Printing | Risk Level | Real World Verdict |
| :------------------ | :--------------------------- | :-------------- | :----------------------------------------------------------------- |
| **Cash in Bank** | ❌ Very Low | Zero Short-Term | Your money loses buying power every single year. |
| **Long-Term Bonds** | ❌ Low | High | Danger of being eaten by inflation unless government steps in. |
| **Big-Cap Stocks** | ✅ High | Medium | Companies pass inflation costs directly to buyers. |
| **Real Estate** | ✅ High | Medium | Land is scarce. Fixed-rate debt gets inflated away by cheap money. |
| **Gold & Silver** | ✅ Very High | Low | 5,000 years of history with zero debt risk. |
| **Bitcoin** | ✅ Very High | High | Fixed 21 million supply limit; digital pristine asset. |
---
### The Seagull's Conclusion
The U.S. economy is not going to sink into the ocean tomorrow. The engine is too big, and the dollar is too strong worldwide.
But the government will pay its $40 Trillion debt by making every dollar worth a little bit less every year.
If you depend only on a cash salary, you are in Steerage. If you move your savings into hard assets, stocks, and land, you are building your own lifeboat. And when sovereign debt pressures trigger sudden market panics, remember that crises do not strike in gentle bell curves; they strike with [fractal power-law turbulence](/blog/the-economic-fractalist).
---
### Works Cited
- Congressional Budget Office. _The Budget and Economic Outlook: 2024 to 2034_. U.S. Government Publishing Office, Feb. 2024, https://www.cbo.gov/publication/59710.
- Federal Deposit Insurance Corporation. _Quarterly Banking Profile: Second Quarter 2026_. FDIC, Aug. 2026, https://www.fdic.gov/analysis/quarterly-banking-profile/.
- Federal Reserve Bank of St. Louis. _Delinquency Rate on Credit Card Loans, All Commercial Banks (DRCCLACBS)_. FRED, Aug. 2026, https://fred.stlouisfed.org/series/DRCCLACBS.
- Federal Reserve Bank of St. Louis. _Personal Saving Rate (PSAVERT)_. FRED, July 2026, https://fred.stlouisfed.org/series/PSAVERT.
- International Monetary Fund. _Currency Composition of Official Foreign Exchange Reserves (COFER)_. IMF Data Portal, 2026, https://data.imf.org/?sk=e6a52467-c4c0-4f2a-a0f6-72a3109364cd.
- Li, Wenhao, and Sebastian Merkel. _Fiscal Dominance and the Macroeconomic Limits of Quantitative Easing_. National Bureau of Economic Research, Working Paper No. 35421, May 2026, https://www.nber.org/papers/w35421.
- U.S. Department of the Treasury. _Treasury International Capital (TIC) System Data_. U.S. Department of the Treasury, 2026, https://home.treasury.gov/data/treasury-international-capital-tic-system.
---
### The Triffin Dilemma and the Dollar Trap: Why Reserve Currencies Always Break
*Canonical URL: https://glassseagull.com/blog/the-triffin-dilemma-and-the-dollar-trap*
*Date: OCT 11, 2026 | Category: Macro Telemetry*
### Key Takeaways & Executive Summary
- **Q: What is the Triffin Dilemma in simple terms?**
- **A: The Triffin Dilemma is an inescapable economic trap discovered by economist Robert Triffin in 1960. It proves that any country whose currency serves as the world's reserve currency must run constant trade deficits to supply global trade with cash. However, running constant deficits floods the world with debt, eventually destroying trust in that currency and collapsing the monetary system.**
- **Q: Why does reserve currency status hurt domestic manufacturing?**
- **A: Foreign nations export goods to the United States and invest their surplus dollars back into US government bonds (Treasuries). Under balance of payments math (Capital Account Surplus = Current Account Deficit), this foreign capital flood forces the United States to consume more than it produces, hollowing out domestic factories in what economists call the 'Exorbitant Burden'.**
---
Picture a game of Monopoly with ten players.
One player sits at the head of the table. He controls the bank.
To keep the game moving, this banker must hand out stacks of colorful paper bills so the other nine players can buy houses, roll dice, and pay rent.
If the banker stops printing money, trade freezes. Nobody can buy properties. The game ends in tears.
```mermaid
flowchart TD
A["World Needs Cash for Trade (Oil, Food, Factories)"] --> B["U.S. Runs Endless Deficits (Sends Dollars Overseas)"]
B --> C["Offshore Dollars Explode (Surpasses Gold / Production)"]
C --> D["Global Trust Fractures (Bank Run on Fort Knox / Treasuries)"]
D -.->|"The Inescapable Trap"| A
```
So the banker keeps handing out slips of paper. Soon, millions of paper bills float around the board.
Suddenly, the players look down at their hands. They realize the banker owes far more cash than the board owns in real houses.
The players panic. They rush the bank to trade their paper for physical deeds.
This game board trap runs the entire modern world. Economists call it **The Triffin Dilemma**.
## Robert Triffin's 1960 Warning to Congress
In 1944, world leaders met in Bretton Woods, New Hampshire. World War II lay in ruins. The United States held roughly seventy percent of the world's gold.
The leaders built a new money system:
1. The United States pegged the dollar to physical gold at exactly **$35 per ounce**.
2. All foreign currencies pegged their money directly to the United States dollar.
If a foreign nation held dollars, it could march up to the United States Treasury and swap thirty-five paper dollars for one physical ounce of gold bullion.
For fifteen years, the system hummed. Then Belgian-American economist Robert Triffin ran the math.
In November 1960, Triffin sat before the United States Congress. He brought a terrifying warning:
> _"The international liquidity problem... stems from the vulnerability of a gold-exchange standard based on national currencies."_ (Triffin 1960)
Triffin pointed out an inescapable mathematical paradox:
- World trade grew rapidly.
- To fuel that trade, foreign central banks needed billions of dollars in their vaults.
- To push those dollars overseas, the United States **had to buy more foreign goods than it sold**. It had to run constant trade deficits.
- But every trade deficit sent more paper claims overseas.
By 1959, offshore dollar liabilities surpassed all the physical gold locked inside Fort Knox.
Triffin warned that foreign nations would eventually realize America could not back every paper dollar with real metal. A global bank run would strike Fort Knox.
## The French Warships and the 1971 Nixon Shock
French economist Jacques Rueff studied Triffin's work. Rueff served as chief economic adviser to French President Charles de Gaulle.
In 1961, Rueff called this system the _"Monetary Sin of the West."_
He pointed out that normal nations face strict limits: if a country spends too much, its currency crashes and forced belt-tightening begins.
```mermaid
sequenceDiagram
autonumber
actor France as French Central Bank
actor US as U.S. Treasury (Fort Knox)
actor Nixon as President Richard Nixon
France->>US: Here are paper dollars. Hand over physical gold at $35/oz!
US->>France: Ships naval gold bars across Atlantic ($22.8B drops to $10.2B)
Nixon->>US: Stop! The vaults are emptying!
Nixon-->>France: August 15, 1971: The Gold Window is CLOSED forever.
```
The United States enjoyed a _"deficit without tears"_ (Rueff 1961). It printed paper money to pay for wars and social programs, while foreign nations hoarded the paper bills.
President de Gaulle refused to play along. On February 4, 1965, de Gaulle held a press conference at the Élysée Palace:
> _"Gold does not change in nature... it has no nationality."_ (de Gaulle 1965)
De Gaulle backed his words with force. France gathered its paper dollar reserves, presented them to the United States Treasury, and demanded physical gold.
Naval ships transported tons of gold bullion across the Atlantic back to Paris.
Between 1952 and August 1971, United States gold reserves plummeted from **$22.8 billion down to $10.2 billion**.
The United States bled gold. On August 15, 1971, President Richard Nixon walked onto national television.
He ended the gold standard forever:
> _"I have directed Secretary Connally to suspend temporarily the convertibility of the dollar into gold."_ (Nixon 1971)
Treasury Secretary John Connally bluntly told European finance ministers:
> _"The dollar is our currency, but your problem."_ (Connally 1971)
The United States defaulted on its gold promise. The world entered a pure paper fiat regime.
## The Mutation: From Gold to the "Exorbitant Burden"
Did Nixon's decision solve the Triffin Dilemma?
No. It made the trap worse.
In 1974, Washington struck a deal with Saudi Arabia. Saudi Arabia agreed to sell its crude oil exclusively in United States dollars. In exchange, the United States provided military protection.
The **Petrodollar** arrived. Every country needed oil, so every country still needed dollars.
Under the new paper system, the Triffin Dilemma shifted from gold bars to factory jobs.
### The Math: Capital Surplus Demands a Trade Deficit
Economists Michael Pettis and Matthew Klein exposed this modern trap in their book _Trade Wars Are Class Wars_.
They showed that reserve currency status brings an **"Exorbitant Burden"**, not an exorbitant privilege.
The rule rests on an unbreakable accounting law:
$$\text{Capital Account Surplus} = \text{Current Account (Trade) Deficit}$$
Here is how the modern machine crushes domestic industry:
1. **Foreign countries run mercantilist policies.** Countries like China, Germany, and Japan suppress domestic wages to produce cheap exports.
2. **They earn massive mountains of dollars.**
3. **They invest those dollars into US Treasury bonds.** If they converted those dollars back into their home currencies, their own exchange rates would surge, making their factories uncompetitive.
4. **Foreign capital floods Wall Street and Washington.** This artificial demand lowers United States interest rates and inflates asset bubbles.
5. **The math strikes back.** Because foreign capital floods in (creating a giant Capital Account Surplus), the United States **must run an equal Current Account Deficit**.
American consumers borrow cheap debt to buy foreign imports. Meanwhile, American factories shut down, manufacturing jobs vanish, and sovereign debt explodes.
```mermaid
flowchart LR
A["Mercantilist Exporters (China, Japan, Germany)"] -->|"Cheap Goods"| B["U.S. Consumers (Trade Deficit)"]
A -->|"Surplus Dollars"| C["Buy U.S. Treasuries (Capital Surplus)"]
C -->|"Cheap Debt & Strong Dollar"| D["Hollows U.S. Factories (Exorbitant Burden)"]
D --> B
```
The reserve issuer sacrifices its middle-class industrial base to pump liquidity to the planet.
## Hard Telemetry: The Multipolar Crackup (2000–2026)
Official economic data tracks the terminal phase of this paper dollar cycle:
### 1. United States Current Account Deficit
According to the Federal Reserve Bank of St. Louis (FRED series `IEABC`), the United States current account deficit widened to a staggering **-$1.177 trillion** for 2025. In the second quarter of 2026 alone, the deficit ran at -$246 billion.
America hemorrhages paper liquidity overseas every single quarter.
### 2. IMF COFER Global Reserve Share
The International Monetary Fund's Currency Composition of Official Foreign Exchange Reserves (COFER) tracks foreign central bank reserves:
| Year | USD Share of Global FX Reserves | EUR Share | Other Non-Traditional Currencies |
| :------------ | :------------------------------ | :-------- | :------------------------------- |
| **2000** | 71.0% | 18.0% | 2.0% |
| **2015** | 65.7% | 19.1% | 4.3% |
| **2025 (Q4)** | **56.77%** | 20.25% | **~10.0%** |
The dollar's reserve share fell from over 71% to below 57%. Crucially, the Euro failed to pick up the slack.
Instead, non-traditional currencies (Canadian dollar, Australian dollar, Swiss franc) and bilateral currency swaps expanded five-fold.
### 3. The Post-2022 Central Bank Gold Rush
In 2022, Western nations froze over $300 billion in Russian sovereign reserves.
Central bankers around the globe watched. They realized that United States Treasuries carry counterparty risk: Washington can cancel them with a keyboard click.
Central banks responded by dumping fiat and hoarding physical gold:
| Metric | Historical Pace (2010–2021) | Post-Freeze Pace (2022–2026) |
| :------------------------------------- | :-------------------------- | :------------------------------------------------------ |
| **Annual Central Bank Gold Purchases** | ~400–500 tonnes / yr | **1,000+ tonnes / yr** (1,082t in 2022, 1,037t in 2023) |
| **Total Global Gold Demand** | ~4,200 tonnes / yr | **>5,000 tonnes** (Record broken in 2025) |
| **Central Bank Future Sentiment** | Neutral | **43% plan to buy more gold** (WGC 2026 Survey) |
Gold hit fifty-three all-time nominal highs in 2025. Central banks treat gold once again as the premier tier-one reserve asset with zero counterparty risk.
## 3 Third-Grade Analogies
Macroeconomics sounds complicated because economists invent big words to hide simple truths. Here are three simple stories that explain the Triffin Dilemma:
### 1. The Amusement Park Tickets
Imagine a giant amusement park with thrilling rollercoasters. The park owner pays for paint, ice cream, and wood from the nearby town by handing out paper ride tickets.
The townspeople gladly accept the tickets. They save them in jars because they love riding the rollercoasters.
Over twenty years, the owner prints millions of extra tickets to buy mountains of toys. Soon, the town holds five million tickets.
One morning, the townspeople look at the tiny park. They realize the park only has room for five thousand riders a day.
If everyone visits at once, the lines will take decades. The tickets become worthless paper. The townspeople stop accepting tickets for ice cream.
### 2. The Town Baker's IOUs
A village baker buys wheat and firewood by writing: _"IOU One Loaf of Bread."_
His sourdough tastes delicious. Soon, villagers trade the baker's IOUs with each other to buy shoes, milk, and blankets. The baker's IOUs become the town's money.
To keep the town growing, the baker must keep writing IOUs.
Ten years later, the baker owes forty thousand loaves of bread. His small stone oven can only bake fifty loaves a day.
The baker is trapped:
- If he stops writing IOUs, the town runs out of money and trade stops.
- If he keeps writing IOUs, the villagers realize he can never bake that much bread.
### 3. The Nightclub Coat Check
You hand your warm coat to a nightclub coat attendant. He hands you a plastic claim tag.
The club manager runs short on cash to pay the band. So the manager prints hundreds of extra plastic claim tags and hands them to the band and bartenders as cash.
By midnight, five hundred plastic claim tags float around the bar, but only eighty coats hang in the closet.
Word leaks out. A mob rushes the coat counter.
To stop the riot, the manager locks the coat room door, throws the key into the sewer, and announces: _"The plastic tags are the new coats!"_
That is what Richard Nixon did in 1971 when he severed the dollar from gold.
## The Sovereign Hull Playbook: How Savers Survive the Reserve Endgame
The Triffin Dilemma guarantees that every unbacked reserve currency faces a terminal dead end.
The issuing government gets trapped between two poisons:
1. **Defend the dollar:** Cut the deficit, raise rates, and starve the world of liquidity. This triggers global depressions and bankrupts the federal government under $36+ trillion in national debt.
2. **Monetize the debt:** Print trillions of dollars to pay interest and fund deficits, destroying the purchasing power of the currency through persistent inflation.
Governments always choose inflation over suicide. They will print.
Here is how the Glass Seagull protects capital:
### Rule 1: Anchor Wealth in Physical Scarcity
Paper currencies expand at the push of a button. Real things do not. Prime productive farmland, energy infrastructure, and critical physical metals carry natural physical constraints that politicians cannot dilute.
### Rule 2: Hold Tier-One Gold
Central banks buy over one thousand tonnes of physical gold every year for a reason. As Charles de Gaulle stated in 1965, gold has no nationality and carries zero counterparty risk. Gold acts as a sovereign hull against monetary storms.
### Rule 3: Use Short-Duration Cash as an Opportunistic Tool
Long-term government bonds guarantee purchasing power destruction under chronic inflation. But short-duration cash (1 to 3-month Treasury bills) provides agility. When liquidity shocks hit markets, cash provides the dry powder needed to scoop up real assets at fire-sale discounts.
Explore live macro telemetry, national debt metrics, and monetary reserves in the Seagull Command Terminal:
---
### Works Cited
Connally, John. "Remarks to Group of Ten Finance Ministers in Rome." _United States Department of the Treasury_, 30 Nov. 1971.
De Gaulle, Charles. "Press Conference at the Élysée Palace." _Fondation Charles de Gaulle_, 4 Feb. 1965, www.charles-de-gaulle.org.
Klein, Matthew C., and Michael Pettis. _Trade Wars Are Class Wars: How Rising Inequality Distorts the Global Economy and Threatens International Peace_. Yale University Press, 2020.
Nixon, Richard. "Address to the Nation Outlining a New Economic Policy: 'The Challenge of Peace'." _CVCE.eu_, 15 Aug. 1971, www.cvce.eu/content/publication/1999/1/1/168eed17-f28b-487b-9cd2-6d668e42e63a/publishable_en.pdf.
Pettis, Michael. "An Exorbitant Burden." _Carnegie Endowment for International Peace_, 7 Sep. 2011, carnegieendowment.org/posts/2011/09/an-exorbitant-burden.
Rueff, Jacques. "The West is Risking a Credit Collapse." _Fortune_, Jul. 1961, pp. 126–129.
Triffin, Robert. _Gold and the Dollar Crisis: The Future of Convertibility_. Yale University Press, 1960.
U.S. Bureau of Economic Analysis. "Balance on Current Account [IEABC]." _FRED, Federal Reserve Bank of St. Louis_, 24 Sep. 2026, fred.stlouisfed.org/series/IEABC.
World Gold Council. "Central Bank Gold Reserves Survey 2026." _World Gold Council_, 16 Jun. 2026, www.gold.org/goldhub/research/central-banks-survey.
World Gold Council. "Gold Demand Trends: Full Year 2025." _World Gold Council_, 31 Jan. 2026, www.gold.org/goldhub/research/gold-demand-trends.
Zhou, Xiaochuan. "Reform the International Monetary System." _Bank for International Settlements_, 23 Mar. 2009, www.bis.org/speeches/20090402-reform-international-monetary-system.
---
### Time Traveling the S&P 500: Historic Cycles
*Canonical URL: https://glassseagull.com/blog/time-traveling-the-sp-500-historic-cycles*
*Date: JUN 28, 2026 | Category: Macro History*
### Key Takeaways & Executive Summary
- **Q: What is the core message of the Glass Seagull macroeconomic framework regarding market troughs like 1932, 1974, and 2009?**
- **A: Generational wealth is forged during periods of peak pessimism and extreme economic distress when valuations are low and risk is mispriced due to systemic fear.**
- **Q: Why are 10-year rolling returns a crucial metric for long-term value investors?**
- **A: They smooth out short-term volatility and demonstrate that despite temporary crises, the compounding machine of human productivity ultimately overwhelms temporary economic chaos.**
---
Imagine for a second that you have a time machine and $10,000 in cash.
You can travel back to any year in the 20th or 21st century to drop that money into the US stock market, with the goal of holding it for exactly one decade. Where do you go?
Naturally, you might think of the Roaring Twenties, the post-war boom of the 1950s, or the dawn of the internet in the 1990s. But if you actually look at the historical data, the absolute most lucrative entry points into the American stock market all share a deeply counterintuitive trait:
**They felt like the absolute worst times to invest.**
Generational wealth is rarely minted when the skies are clear and the news is good. It is forged during periods of peak pessimism, extreme economic distress, and visceral fear. Let's take a quick tour through history to see what this looks like in practice.
## Stop 1: The Great Depression Bottom (1932)
**The Vibe:** The Dow Jones Industrial Average has lost nearly 90% of its value from its 1929 peak. Breadlines stretch around city blocks, unemployment is sitting at a staggering 25%, and the global banking system is actively collapsing.
**The Investment:** Putting money into stocks right now feels like setting it on fire. But because the market has fully priced in an economic apocalypse, valuations are in the single digits. Buying at this point of maximum despair captures a staggering secular recovery over the ensuing decades, offering massive dividend yields combined with capital appreciation that will define a generation of wealth.
## Stop 2: The Stagflation Trough (1974)
**The Vibe:** The US economy is reeling. The OPEC oil embargo has cars lined up for miles just to get gas. The country is suffering from rampant "stagflation" (a toxic mix of high inflation and high unemployment) while the political fallout of the Watergate scandal dominates the news cycle. The market has dropped nearly 50% from its 1973 high.
**The Investment:** Inflation and rising interest rates have crushed stock multiples. But buying when the S&P 500 P/E ratio drops to roughly 7x allows you to lock in historically low prices. It provides a massive margin of safety before the economy eventually stabilizes, leading into the epic bull runs of the 1980s.
## Stop 3: The Great Financial Crisis (2009)
**The Vibe:** The global financial system is seemingly on the brink of total, irreversible collapse due to the subprime mortgage crisis. Venerable institutions like Lehman Brothers have vanished in an instant. In March 2009, the S&P 500 touches a terrifying intraday low of 666.
**The Investment:** It feels reckless to buy stocks when major banks are disappearing overnight. But if you drop your $10,000 into the market at this exact moment, you are buying at the absolute ground floor. You are about to ride a relentless, decade-long bull market, supercharged by central bank interventions and a tech boom that will define the 21st century.
## The Proof is in the Data
It's easy to look back at history and say, "You should have bought." But what does that actually look like on a timeline?
Below is a comparison of these three historical entry points:
| Epoch Trough | Peak-to-Trough Drawdown | S&P 500 P/E Ratio | Systemic Catalyst | 10-Year Forward CAGR |
| :--------------------- | :---------------------- | :---------------- | :--------------------------- | :------------------- |
| **1932** (Depression) | -86.2% | ~5.2x | Banking System Collapse | +10.1% / yr |
| **1974** (Stagflation) | -48.2% | ~7.1x | OPEC Oil Embargo / Inflation | +10.5% / yr |
| **2009** (GFC) | -56.8% | ~11.2x | Subprime Mortgage Meltdown | +14.2% / yr |
Below are the charts that tell the ultimate story of American wealth creation. _Hover over the charts to see the exact data for any given year._
If you look closely at the middle chart, a 10-year period hovering near 0% (like the aftermath of the 1929 crash or the 2008 Financial Crisis) was deeply painful for anyone living through it.
But look at those exact same periods on the top chart.
On a century-long timeline, those world-shaking events look like nothing more than temporary stair-steps on a relentless, upward trajectory. The compounding machine of human productivity ultimately completely overwhelms short-term economic chaos.
## The Thread That Ties Them Together
What do 1932, 1974, and 2009 have in common?
They prove that the stock market is a forward-looking discounting mechanism. By the time the news is unequivocally terrible and everyone agrees the economy is ruined, the market has already priced it in.
Human nature never changes. Our brains are hardwired for survival: when we see danger, our instinct is to run and hide. But the history of the stock market demands the exact opposite.
To build real wealth, you have to train your brain to act against its own survival instincts. When everyone else is panicking, you need to recognize the clearance sale. History doesn't always repeat itself, but humans panic the exact same way every single time. The best investors are simply the best students of history.
---
### The Seagull's View: Why 2026 is 1974
*Canonical URL: https://glassseagull.com/blog/why-2026-is-1974*
*Date: OCT 12, 2025 | Category: Macro History*
### Key Takeaways & Executive Summary
- **Q: Why does The Glass Seagull macroeconomic framework compare 2026 to 1974?**
- **A: Because both periods exhibit severe stagflation signals, characterized by a massive buildup in sovereign debt acting as fuel for an energy-driven catalyst.**
---
The "Glass Seagull" perspective is about **Human-Centricity**. We don't look at charts; we look at the people making the charts move. As the old saying goes: _"Tactics change, but hunger remains."_
### The Rule of 7
Consistency builds trust. In a world of flashing lights (Trends), the steady beat of a consistent message (Principles) is the only thing that breaks through. Are you building a relationship, or just closing a transaction?
We are seeing patterns in the bond market that mirror the late 1973 setup almost perfectly. The energy crisis then was the catalyst, but the _debt structure_ was the fuel. Today, the catalyst is different, but the fuel (sovereign debt) is piled even higher.
> "You don't need to be the smartest bird in the sky. You just need to know where the fishing boats are going."
When the tide goes out, we see who has been swimming naked. But the Seagull is already in the air, watching the tide recede from a safe distance, spotting the opportunities revealed in the mud.
---
### The Yield Curve Guillotine: 1946, 2028, and the $50T Debt
*Canonical URL: https://glassseagull.com/blog/the-yield-curve-guillotine*
*Date: AUG 18, 2026 | Category: Macro History*
### Key Takeaways & Executive Summary
- **Q: What is the significance of the $50 Trillion debt threshold?**
- **A: At $50 Trillion, the compounding interest expense begins to consume a terminal percentage of tax receipts, forcing the central bank into yield curve control and structural currency debasement.**
- **Q: How will the government avoid a nominal default?**
- **A: Through "Financial Repression." As seen post-WWII, the Federal Reserve will cap bond yields artificially low while letting inflation run hot, effectively taxing bondholders via negative real yields.**
---
Right now, prediction markets and quantitative telemetry models are pricing in a roughly 35% probability that the United States National Debt will breach the $50 Trillion mark by 2028 (Kalshi). Meanwhile, institutional analysts at Bank of America project the debt will definitively cross this threshold by 2029 (Bank of America).
Politicians can play ostrich and bury their heads in the sand, but the Seagull only cares about the math. Partisan bickering is noise. Compounding interest is the only signal that matters.
As of August 2026, the gross national debt is scraping against the $40 trillion ceiling. Fitch Ratings projects the federal debt-to-GDP ratio will hit 123% by the end of 2028 (Fitch Ratings). When an economic machine carries a debt load of 123% of its total output, traditional fiscal policy ceases to function. You cannot tax your way out of a $50 Trillion hole, and you certainly cannot grow your way out of it when demographic headwinds are slowing GDP.
So, how does the machine survive? It looks backward. It dusts off the playbook from 1946.
## The Ghost of 1946: When Debt Peaked
To understand 2028, you must look at 1946.
Following the massive expenditure required to win World War II, the United States' debt-to-GDP ratio hit an all-time high of 119%. The mathematical reality was identical to our current trajectory: the debt load was too massive to be paid back in standard, un-inflated dollars, and the interest expense threatened to consume the entire federal budget.
Did the United States default? No. Did it implement crushing austerity? No.
It utilized a mechanism known as **Financial Repression**.
Between 1942 and 1951, the Federal Reserve and the Treasury colluded to explicitly cap the yield on long-term government bonds at 2.5%, and short-term bills at 0.375% (Reinhart and Sbrancia 24). At the same time, post-war inflation was allowed to run rampant, occasionally spiking into the double digits.
### The Stealth Tax
This is the "Yield Curve Guillotine." If inflation is running at 8%, but the government forces bond yields to stay at 2.5%, the _real_ yield is negative 5.5%.
Anyone holding government debt is slowly, silently bleeding purchasing power. That missing purchasing power doesn't just vanish. It is transferred directly to the debtor. The government effectively liquidates its massive debt burden by stealing the wealth of its bondholders through inflation, all while nominally paying back every single dollar it owes. There is no technical default, only a severe destruction of capital.
## The 2028 Playbook: Monetizing the Abyss
As we barrel toward a $50 Trillion debt load, the Federal Reserve will have no choice but to implement a modern version of Yield Curve Control (YCC). If they allow interest rates on $50 Trillion to float to natural, market-clearing levels (say, 6% or 7%), the annual interest expense alone would eclipse $3 Trillion. That expense would consume the majority of all federal tax revenue, crowding out defense, Medicare, and Social Security entirely.
They cannot allow that to happen. Therefore, they will cap yields.
They will force banks, pension funds, and foreign reserves to absorb this low-yielding debt through regulatory requirements. And they will allow inflation to run structurally higher than the 2% target, perhaps tolerating 4% to 5% inflation for a decade.
## Positioning the Nest: Surviving the Guillotine
When the Yield Curve Guillotine drops, fiat cash and long-term bonds become toxic assets. They are the instruments of your own confiscation.
To survive a prolonged period of Financial Repression, capital must be positioned in assets that cannot be printed and that natively absorb fiat debasement:
1. **Scarce Equities:** Cash-flowing businesses with pricing power. If a company can raise the price of its goods to match inflation, its equity acts as an inflation shield.
2. **Hard Infrastructure & Real Estate:** Assets that have fixed, long-term debt attached to them. In an inflationary environment, your debt is inflated away while the nominal value of the physical asset rises.
3. **Algorithmic Scarcity:** Assets like Bitcoin provide an outside-the-system release valve that cannot be diluted by sovereign debt monetization.
The $50 Trillion milestone is not an apocalypse; it is simply a mathematical phase transition. The machine will not break, it will just change the rules. While the rest of the flock panics, the Seagull swoops in to steal the chips before they even hit the sand. For empirical telemetry on historical stock drawdowns across past cycles, read our companion breakdown on [Yield Curve Inversion and Stock Market Performance](/blog/yield-curve-inversion-stock-market-performance).
---
### Works Cited
Bank of America. "U.S. National Debt Projected to Hit $50 Trillion by 2029." _BofA Global Research_, 2026.
Fitch Ratings. "U.S. Sovereign Credit Update: Debt Trajectories and Fiscal Deficits." _Fitch Ratings Macro Research_, Aug. 2026.
Kalshi. "Prediction Markets: U.S. National Debt to Reach $50T by 2028." _Kalshi Exchange_, Aug. 2026.
Reinhart, Carmen M., and M. Belen Sbrancia. "The Liquidation of Government Debt." _National Bureau of Economic Research_, Working Paper 16893, Mar. 2011, pp. 24-28.
---
### Yield Curve Inversion and Stock Market Performance: The Danger Zone
*Canonical URL: https://glassseagull.com/blog/yield-curve-inversion-stock-market-performance*
*Date: OCT 10, 2026 | Category: Market Cycles*
### Executive Briefing (AI Context & Direct Answer)
- **Q: How does a yield curve inversion affect stock market performance?**
- **A: A yield curve inversion does not immediately crash the stock market. Historically, the S&P 500 continues to rally for an average of 11 to 18 months while the curve stays inverted. The true stock market crash occurs during the "un-inversion", the moment the yield curve rapidly steepens back above zero as the Federal Reserve cuts interest rates to fight an unfolding recession.**
- **Q: Why is the un-inversion more dangerous than the initial inversion?**
- **A: The initial inversion signals structural stress in commercial banking. The rapid un-inversion signals that economic damage has arrived. As short-term interest rates collapse due to emergency central bank easing, corporate earnings plunge, credit markets freeze, and equities experience their deepest drawdown phase.**
---
Most financial news channels teach investors the wrong lesson about the yield curve.
When the 10-year Treasury yield drops below the 2-year Treasury yield, news anchors panic. They shout that a recession is coming tomorrow and tell people to sell all their stocks.
Then, something confusing happens: **stocks keep going up.**
In 1989, 2000, 2006, and again during the massive 2022–2024 inversion cycle, the S&P 500 pushed to brand new all-time highs _after_ the yield curve inverted. Investors who sold on day one of the inversion watched the market rally without them.
The Glass Seagull tracks math, not headlines. Here is how yield curve inversion and stock market performance actually interact across history.
---
### The Runway Analogy: Warning Light vs. Engine Failure
Think of the yield curve like the warning instrument panel inside an airplane cockpit:
1. **The Inversion (The Yellow Light):** The panel flashes yellow. A severe thunderstorm sits 50 miles ahead on the flight path. The plane is still flying high in clear air, but conditions ahead are deteriorating.
2. **The Inverted Valley (The Delay):** The plane continues through the clouds for hundreds of miles. Passengers order drinks. Everyone assumes the sensor was broken.
3. **The Un-Inversion (The Mountain):** The pilots spot the mountain right in front of the windshield. They cut the engines and pull the emergency brake. **This is when the drop happens.**
The initial inversion is merely the warning sensor. The rapid **un-inversion** is the impact.
---
### The Historical Scorecard: Inversion vs. Un-Inversion
Every major economic recession and stock market collapse over the past fifty years followed this precise sequence:
| Cycle Period | Date Curve Inverted | S&P 500 Peak After Inversion | Date Curve Un-Inverted | Subsequent Stock Market Crash |
| :--------------------------------- | :------------------ | :--------------------------- | :--------------------- | :------------------------------ |
| **1973 Oil Shock** | June 1973 | +8.4% gain | December 1973 | **-48% S&P 500 drop** |
| **1980 Volcker Squeeze** | August 1978 | +15.2% gain | May 1980 | **-27% S&P 500 drop** |
| **2000 Dot-Com Bust** | February 2000 | +7.1% gain | January 2001 | **-49% S&P 500 drop** |
| **2007 Great Financial Crisis** | December 2005 | +24.6% gain | June 2007 | **-57% S&P 500 drop** |
| **2020 Liquidity Shock** | August 2019 | +12.3% gain | October 2019 | **-34% S&P 500 drop** |
| **2022–2026 Sovereign Supercycle** | July 2022 | +38.5% gain | September 2024–2026 | **Ongoing un-inversion regime** |
Look closely at the data. In every single cycle, equities gained between 7% and 38% _after_ the initial inversion.
The bloodbath only begins once the curve shoots back above zero.
---
### Why the Un-Inversion Triggers the Liquidation
Why does the market wait for the curve to un-invert before selling off?
The answer comes down to commercial banking mechanics:
1. **Banks Live on the Spread:** Normal banks borrow money from depositors at short-term rates and lend money to businesses and home buyers at long-term rates.
2. **Inversion Chokes the Pipes:** When short rates climb above long rates, banks lose money on new loans. They tighten lending standards and pull back credit lines.
3. **The Lag Effect Takes Time:** It takes 12 to 18 months for tighter bank loans to slow down corporate hiring and consumer spending.
4. **Emergency Rate Cuts Trigger Un-Inversion:** When unemployment finally jumps and corporate defaults rise, the Federal Reserve panics. They aggressively slash short-term interest rates.
When short-term rates collapse faster than long-term rates, the yield curve un-inverts. But the Fed does not cut rates because things are going well. They cut rates because the real economy is breaking.
Right as the curve normalizes, corporate earnings collapse, layoffs spike, and stock valuations readjust to reality with [fractal market turbulence](/blog/the-economic-fractalist).
---
### How to Navigate the Un-Inversion Regime
When the yield curve un-inverts while the federal government runs [record national debt](/signals/us-debt-clock), traditional 60/40 stock and bond portfolios face severe pressure:
- **Do Not Short Early:** Shorting stocks simply because the curve inverted burns capital during the final speculative melt-up.
- **Track the Re-Steepening:** When the 10Y-2Y spread crosses from negative to positive, switch your stance from offensive growth to defensive capital preservation.
- **Prioritize Hard Collateral:** During post-inversion liquidations, fiat currency loses purchasing power as central banks print liquidity to rescue the financial system. Physical gold, real assets, and disciplined cash reserves serve as your primary lifeboat.
- **Inspect Your Fiduciary:** Ensure your wealth advisor operates as a true [fee-only fiduciary](/blog/how-to-vet-a-financial-advisor) rather than someone earning commissions selling high-fee equity funds into an un-inversion storm.
The yield curve is not an opinion. It is the plumbing of global finance telling you exactly which chapter of the cycle is playing out.
---
### Works Cited
- Estrella, Arturo, and Frederic S. Mishkin. "Predicting U.S. Recessions: Financial Variables as Leading Indicators." _The Review of Economics and Statistics_, vol. 80, no. 1, 1998, pp. 45–61.
- Federal Reserve Bank of St. Louis. _10-Year Treasury Constant Maturity Minus 2-Year Treasury Constant Maturity (T10Y2Y)_. FRED, Oct. 2026, fred.stlouisfed.org/series/T10Y2Y.
- Harvey, Campbell R. "The Real Term Structure and Consumption Growth." _The Journal of Financial Economics_, vol. 22, no. 2, 1988, pp. 305–333.
- National Bureau of Economic Research (NBER). _U.S. Business Cycle Expansions and Contractions_. NBER Business Cycle Dating Committee, 2026, nber.org/research/data/us-business-cycle-expansions-and-contractions.
---
### The Zero-to-One Portfolio: A Practical Blueprint for Inflation Survival
*Canonical URL: https://glassseagull.com/blog/zero-to-one-portfolio*
*Date: AUG 15, 2026 | Category: Macro Economics*
> _"What's up Seagull. We met a few times and were talking about investing. I would like to know what are some good things to look into as far as investing for a beginner. I'm not looking for an immediate return but something that could eventually become something."_
Most people would tell you to open a Roth IRA, buy an index fund, and wait forty years.
They are not entirely wrong. But they are missing the bigger picture.
Before we talk about _what_ to buy, you need to understand _why_ your money is already losing the race before you've even started. The national debt is a mathematical black hole. Every dollar printed dilutes every dollar you already have in your pocket.
You are standing on a treadmill that is slowly accelerating. If you stand still, you fall off.
### Why "Beginner Investing" is a Trap
The standard advice is designed for a stable, low-inflation world. We do not live in that world anymore.
You are being subjected to the **Consumer Mirage**.
Wages track consumer goods. The price of milk, a flat-screen TV, and basic apparel. But the assets you actually need to build wealth (housing, land, productive businesses) hyperinflate.
Your 7% average stock market return is a _nominal_ gain. It's just a bigger number on a screen. Adjust for real inflation and the debasement of the fiat currency, and you are merely treading water.
Since 1971, median home prices have risen over 4,000%. The S&P 500 is up over 7,000%.
Sounds great. Until you realize _most people own neither_ because they couldn't afford the entry price while their wages stagnated in real terms. The system requires you to acquire hard assets, but prices them out of reach.
So, how does a beginner actually start from zero?
### Phase 1: Kill the Debt Before It Kills You
This is the step most standard financial advice glosses over.
Credit card debt at 24% APR is the single most destructive force on a beginner's portfolio. You cannot build a fortress if there is a massive hole in the wall.
No investment in history has guaranteed a 24% annual return. Paying off that credit card is a guaranteed 24% gain. It stops the bleeding immediately.
List your debts. Smallest to largest. Pay off the highest-interest poison first. You are not investing yet. You are surviving.
### Phase 2: Invest in Your Human Capital First
This is the most radical truth in the Glass Seagull framework.
The highest-ROI "asset" a beginner can own is their own earning power. Human Capital is the only thing that prints cash regardless of the macroeconomic weather.
A skill that makes you go from $20 an hour to $60 an hour is a 200% return on whatever you spent learning it.
A course that costs $500 and gets you a $20,000 raise is the greatest investment in history. No hedge fund has ever beaten that.
Learn to code. Learn technical sales. Learn a specialized trade. Buy back your time so you can generate the cash needed to enter the asset markets.
### Phase 3: The Hard Asset Ladder
Once the bleeding has stopped and your human capital is generating surplus cash, you can begin climbing the ladder.
**Rung 1: The Liquidity Buffer**
You need 3 to 6 months of living expenses in a high-yield savings account or short-duration T-bills. This is not an investment. This is a moat. This prevents you from having to sell your real assets at a loss when your car breaks down.
**Rung 2: Inflation-Resistant Assets**
You must step outside the fiat system to protect your purchasing power from debasement.
- Gold has 5,000 years of history preserving purchasing power.
- Bitcoin is the digital analog. It has high volatility, but a hard-capped supply against infinite fiat printing.
**Rung 3: Equity in Productive Businesses**
Index funds are not wrong. They are just incomplete without the first two rungs beneath them. Look for businesses that benefit from inflation: energy producers, commodity miners, and real estate.
### The Seagull Rule for Beginners
If you take nothing else away from this, write this rule down.
> **The stock market is a game for people with surplus cash. Before you try to pick a winning stock, pick a high-income skill and kill your high-interest debt. Your first, and highest-yielding investment, should always be yourself.**
A reader texted a question that millions of people have. The difference is they actually asked. Now you have the answer. Take the first step.
---
## MACROECONOMIC DICTIONARY
### Delivery Fee
*Part of Speech: n.*
1. An extra service charge added by phone apps to carry food from a shop to your home.
Delivery fees turn a simple food purchase into a logistics transaction. When you use an app, you pay for the food, the tech company, and the driver all at once.
### Direct Listing
*Part of Speech: n.*
1. A public listing mechanism where a private company lists existing shares directly on an exchange without underwritten capital creation, bookbuilding, or underwriter discounts.
Unlike traditional IPOs, direct listings generate no primary capital for the corporate balance sheet and feature no syndicate price support on opening day.
### Fiduciary Standard
*Part of Speech: n.*
1. A legal obligation requiring an advisor to act in a client's best interest at all times, as opposed to the weaker "suitability" standard that only requires a recommendation to be adequate, not optimal.
The gap between "suitable" and "in your best interest" is where most bad financial products get sold. Ask which standard applies before you ask anything else.
### Fee-Only Advisor
*Part of Speech: n.*
1. A financial advisor compensated only by a flat fee or hourly rate paid directly by the client, never by commission or a percentage of assets under management.
"Fee-only" and "fee-based" are not the same thing, and the similarity is not an accident. If you hear "fee-based," ask what else they're paid on top of the fee.
### Glass-Steagall Act
*Part of Speech: hist.*
1. The Banking Act of 1933, separating commercial and investment banking in the U.S. in response to the 1929 crash; substantially repealed in 1999.
Yes, that's where the name comes from. A wall built to separate two kinds of risk-taking, mostly torn down before most readers of this site were watching markets. Read the complete story in [The Wall They Tore Down](/blog/glass-steagall-repeal-and-the-seagull-doctrine) or see how it hit our front door in [the origin story](/origin-story).
### IPO Flipping
*Part of Speech: n.*
1. The practice of liquidating primary IPO shares on the first day or within the first 30 days of trading to lock in an immediate listing pop.
Investment banks enforce flipping penalties through retail brokerages to keep opening prices stable, trapping retail investors in holding positions while institutions hedge.
### Oversubscription
*Part of Speech: n.*
1. A condition where total cumulative orders for an equity offering exceed the gross number of shares made available by the issuer.
Oversubscription is the primary reason retail investors receive miniscule allocations in hot offerings while institutional funds receive 90% of the book.
### Lock-Up Period
*Part of Speech: n.*
1. A contractual window (typically 90 to 180 days) post-IPO during which founders, early employees, and venture capital backers are legally prohibited from selling their shares on the open market.
During the lock-up period, the public float is artificially restricted, keeping prices buoyant. When the period ends, insider selling often triggers sudden supply dilution.
### Net Revenue Retention
*Part of Speech: n.*
1. A cohort measurement of recurring revenue generated from existing customers over a period, incorporating upsells, expansion, cross-sells, downgrades, and churn.
Net Revenue Retention above 100% demonstrates negative churn and organic cohort expansion, a key fundamental requirement for top-tier enterprise software valuations.
### Profit Margin
*Part of Speech: n.*
1. The portion of money a business keeps as net earnings out of every dollar in total sales after paying all expenses.
Profit margin shows how much cash a business keeps from its revenue. High margins mean a business has strong pricing power over its customers.
### Seagull
*Part of Speech: n.*
1. A gull, especially one found near coastlines; a scavenging seabird known for opportunistic feeding and sharp downward vision.
2. (fig., this site) One who scavenges signal from the noise of financial markets rather than following the flock. See Manifesto.
The seagull doesn't predict the tide. It watches, waits, and moves when something real surfaces, which is a decent description of the second sense above, and not an accident.
### Rule of 40
*Part of Speech: n.*
1. An empirical valuation metric in tech and venture capital stating that a software firm's year-over-year revenue growth percentage plus its free cash flow margin should total at least 40%.
A high-growth business burning cash or a mature business generating large cash flows can both satisfy the Rule of 40, balancing growth against operational profitability.
## GLOSSARY
### Albatross
An albatross around the neck. In our context, this refers to massive, unpayable sovereign debt or structurally depreciating assets that drag down economic mobility.
### Asset Meltdown Hypothesis
The hypothesis that systematic portfolio liquidations by the retiring Baby Boomer generation ($84T in wealth) will outpace the absorption capacity of a smaller, debt-burdened younger generation. In modern fiat economies, this demographic liquidation is obscured through currency debasement and fiscal dominance rather than nominal price collapse.
→ Read the full investigation: [The Asset Meltdown Hypothesis](/blog/the-asset-meltdown-hypothesis).
### APR
Annual Percentage Rate. The yearly interest generated by a sum that's charged to borrowers or paid to investors. When applied to credit card debt, it represents the compounding wealth destruction that banks legally inflict on consumers.
### Asymmetric Risk/Reward
An investment profile where the potential upside vastly outweighs the downside (e.g., risking $1 to make $20). The holy grail of contrarian investing, allowing you to be wrong frequently but still win.
### Black Swan
An unpredictable event with massive consequences. Models ignore them because they are 'rare.' History is defined by them.
### Cantillon Effect
The observation that new money benefits those closest to the printer (banks/gov) first, while rising prices hurt the poor last.
### Contrarian
An investor who bets against the crowd. The crowd is right in the middle of a trend, but wrong at the turns. We hunt the turns.
### Debasement
The deliberate reduction in the purchasing power of a money supply, historically done by mixing cheap metals into coinage, now done via digital credit creation. A silent tax on savers.
### Canary in the Coal Mine
An early warning signal of macroeconomic danger. Historically, miners brought canaries into mines to detect toxic gases. In markets, it refers to leading indicators like credit card delinquency rates.
### Convenience Yield
Convenience Yield is the extra non-financial value or safety benefit investors get from holding an asset like the U.S. Dollar or U.S. Treasuries. Because the Dollar is used everywhere in world trade, the U.S. government can borrow up to 30% more debt than other countries without immediate interest rate spikes.
### Direct Listing
When a company lists its shares on a public stock exchange directly, without hiring Wall Street investment banks as underwriters or issuing new shares. Insiders sell their existing shares directly to the market at opening.
### Economic Fractal
A market modeling framework founded on Benoit Mandelbrot's fractal mathematics. Unlike traditional Bell Curve finance which assumes market price changes are random and normally distributed, fractal economics recognizes power-law fat tails, memory cycles, and recursive self-similarity across timeframes. This explains why sudden financial crashes and stagflationary shocks occur far more frequently than conventional models predict.
→ Read the full investigation: [The Economic Fractalist Report](/blog/the-economic-fractalist).
### Fiat Currency
Paper money backed by nothing but government promises. Historically, it always returns to its intrinsic value: zero.
### Financial Repression
A set of government policies (including keeping interest rates artificially below the rate of inflation, capital controls, and high reserve requirements) designed to channel funds to public debt servicing at a negative real rate of return. Effectively, it acts as a stealth tax on savers to dilute national debt.
### Fiscal Dominance
Fiscal Dominance occurs when government debt and interest expenses grow so huge that the central bank can no longer raise interest rates without causing government bankruptcy. In this state, the central bank must keep rates low or print money to buy government bonds (debt monetization), leading to ongoing inflation and currency debasement.
### Flocking Behavior
When market participants blindly follow the momentum of the crowd rather than analyzing fundamental telemetry. Often precedes a market correction.
### Hard Asset
Something you can drop on your toe. Gold, Land, Commodities. Assets that cannot be printed by a central banker.
### IPO Flipping
Selling allocated IPO shares within the first 30 days of public trading to lock in a quick first-day profit. Brokerage firms track this practice and punish sellers with 60-day to 180-day bans from future IPO allocations.
### Lock-Up Period
A rule that stops company founders, early workers, and venture capital backers from selling their shares for 90 to 180 days after the company goes public. This rule prevents an immediate flood of insider selling from crushing the stock price on day one.
### Maximum Drawdown
The peak-to-trough decline of an investment or portfolio before a new peak is attained. The ultimate metric of psychological pain, showing what you must endure to realize long-term returns.
### Minsky Moment
The sudden, chaotic collapse of asset values marking the end of a long period of economic stability and credit expansion. Named after economist Hyman Minsky, it occurs when over-leveraged investors are forced to sell off assets to meet debt obligations, triggering a self-reinforcing liquidity crisis.
### Net Revenue Retention
A percentage that measures how much annual recurring revenue changes from existing customers over a 12-month period, including upsells, downgrades, and cancellations. A score above 100 percent means existing customers are expanding their spend.
### Moral Hazard
The phenomenon where market actors take extreme risks because they know the negative consequences will be borne by others (usually taxpayers/central bank bailouts).
### Oversubscription
When total investor demand for shares in an offering exceeds the number of shares the company wants to sell. In oversubscribed offerings, Wall Street underwriters give about 90% of shares to institutional whales, while retail buyers receive heavily diluted allocations.
### Price-Specie-Flow Mechanism
An economic principle formulated by David Hume in 1752 demonstrating that international trade balances self-correct under a metallic gold or silver standard (specie). Trade deficit nations export physical gold, causing domestic money supplies and prices to fall, which naturally restores export competitiveness until gold flows back.
→ Read the full investigation: [David Hume's Price-Specie-Flow Mechanism](/blog/the-price-specie-flow-mechanism).
### Quantitative Easing
A polite term for 'printing money.' Central banks create digital credits to buy assets, diluting the value of your savings.
### Real Inflation
The actual loss of purchasing power you experience in the real world, as opposed to the "official" CPI metrics published by governments. Real inflation factors in the soaring costs of hard assets, housing, and energy that are often under-weighted or manipulated in standard consumer price indices.
### Real Yield
The interest rate you get minus inflation. If the bank pays 5% but inflation is 8%, your real yield is -3%. You are losing wealth.
### Risk-Adjusted Return
The return on an investment relative to the volatility and risk taken to achieve it. In a central-bank distorted world, nominal gains are vanity; adjusting for drawdown probability and volatility is sanity.
### Rule of 40
A quick benchmark used to evaluate software and technology companies. It states that a healthy software company's yearly revenue growth rate plus its profit margin should equal or exceed 40 percent.
### Spot Price
The price of an asset right now, for immediate delivery. Paper markets (futures) can distort the price, but Spot is truth.
### Stagflation
A destructive economic phase characterized by stagnant economic growth, high unemployment, and persistent inflation. Conventional Keynesian monetary policy struggle to address this, as fighting inflation (by raising rates) worsens stagnation, while stimulating growth (by lowering rates or printing money) worsens inflation.
### Steerage Economy
The Steerage Economy refers to lower and middle-income households who earn wages and hold cash savings without owning stocks or real estate. During periods of high inflation or currency debasement, their purchasing power gets wiped out while asset owners in "First Class" see their net worth expand.
### Velocity of Money
The speed at which money changes hands. High velocity means a booming economy (or hyperinflation). Low velocity means stagnation.